From Backend to Beta: vFunction's First Customer Interface
AboutvFunction, a Palo Alto–based deep tech startup, was tackling one of DevOps’ biggest challenges: migrating legacy applications to the cloud. Their powerful backend could analyze software complexity, offload CPU processes to AWS Lambda, and calculate cost savings automatically — but without a customer-facing interface, the technology had no path to market.
How it worksWhen I joined the project at Fathom, my role was to design vFunction’s first self-serve product experience: a beta platform that would showcase the tech, attract early customers, and support high-stakes investor demos.
Project Breakdown
ContextClient: vFunction, Palo Alto–based deep tech startup
Challenge: brilliant backend for AI-driven cloud migration, but no customer-facing product
Role: Lead UX/Product Designer at Fathom (London)
Team: 1 Visual designer, 1 developer, 1 lead UX
Timeline: 12 weeks to design and ship MVP
My role and approachTranslated complex backend tech into an intuitive, self-serve interface
Aligned stakeholders, clarified value proposition, and ran discovery workshops
Designed user flows, wires , data visualisations, and onboarding experience
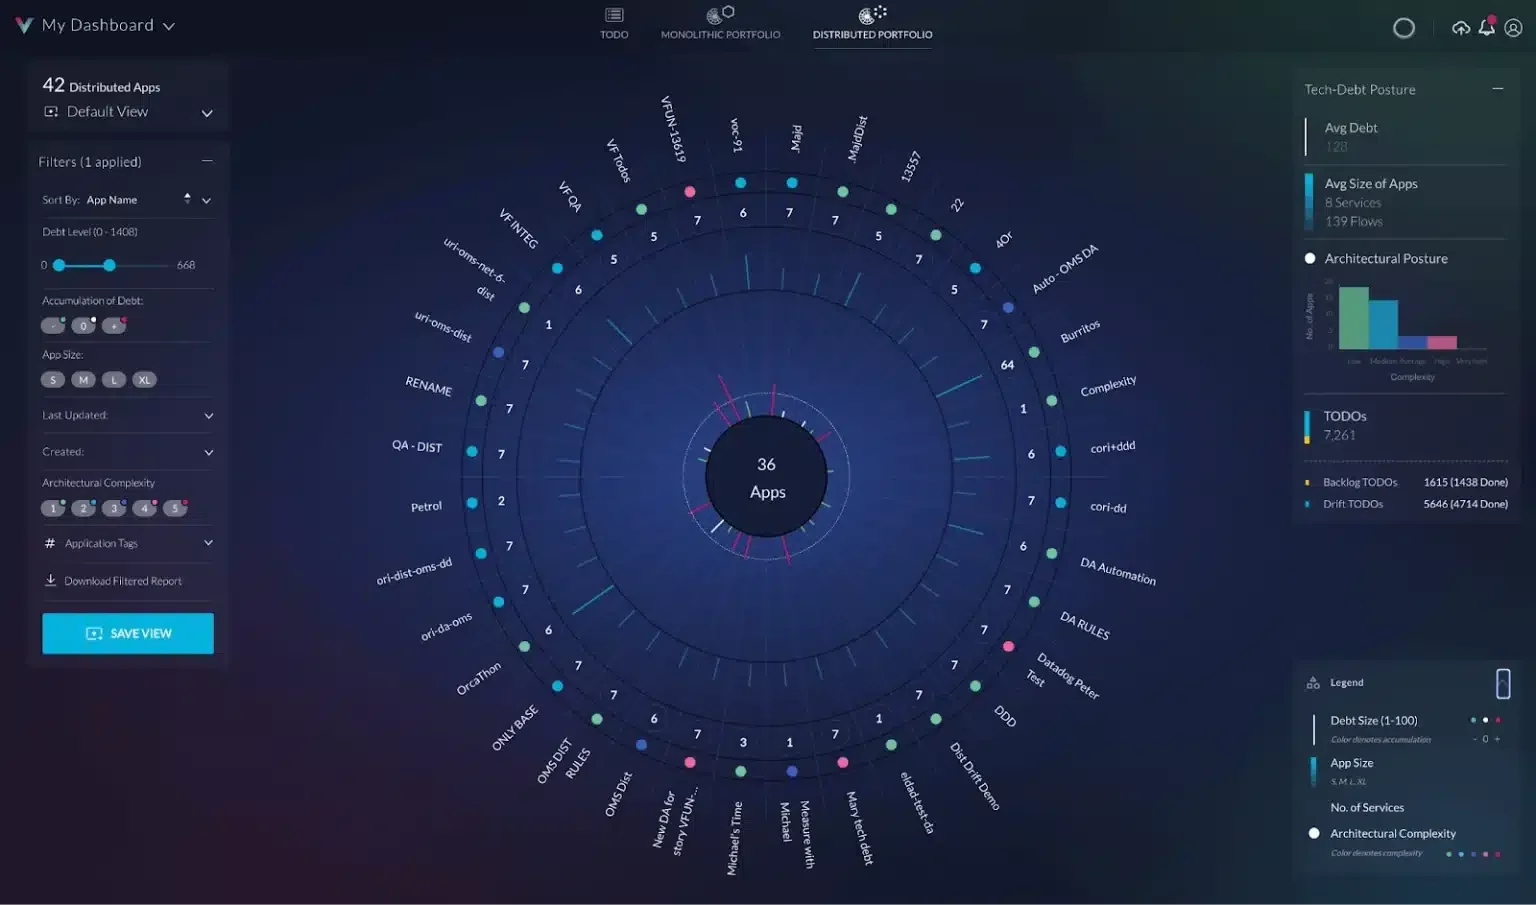
Borrowed design patterns from gaming + cockpit interfaces to engage DevOps engineers
Key UX SolutionsDual-audience design: spoke to both DevOps users (hands-on) & business leaders (decision-makers)
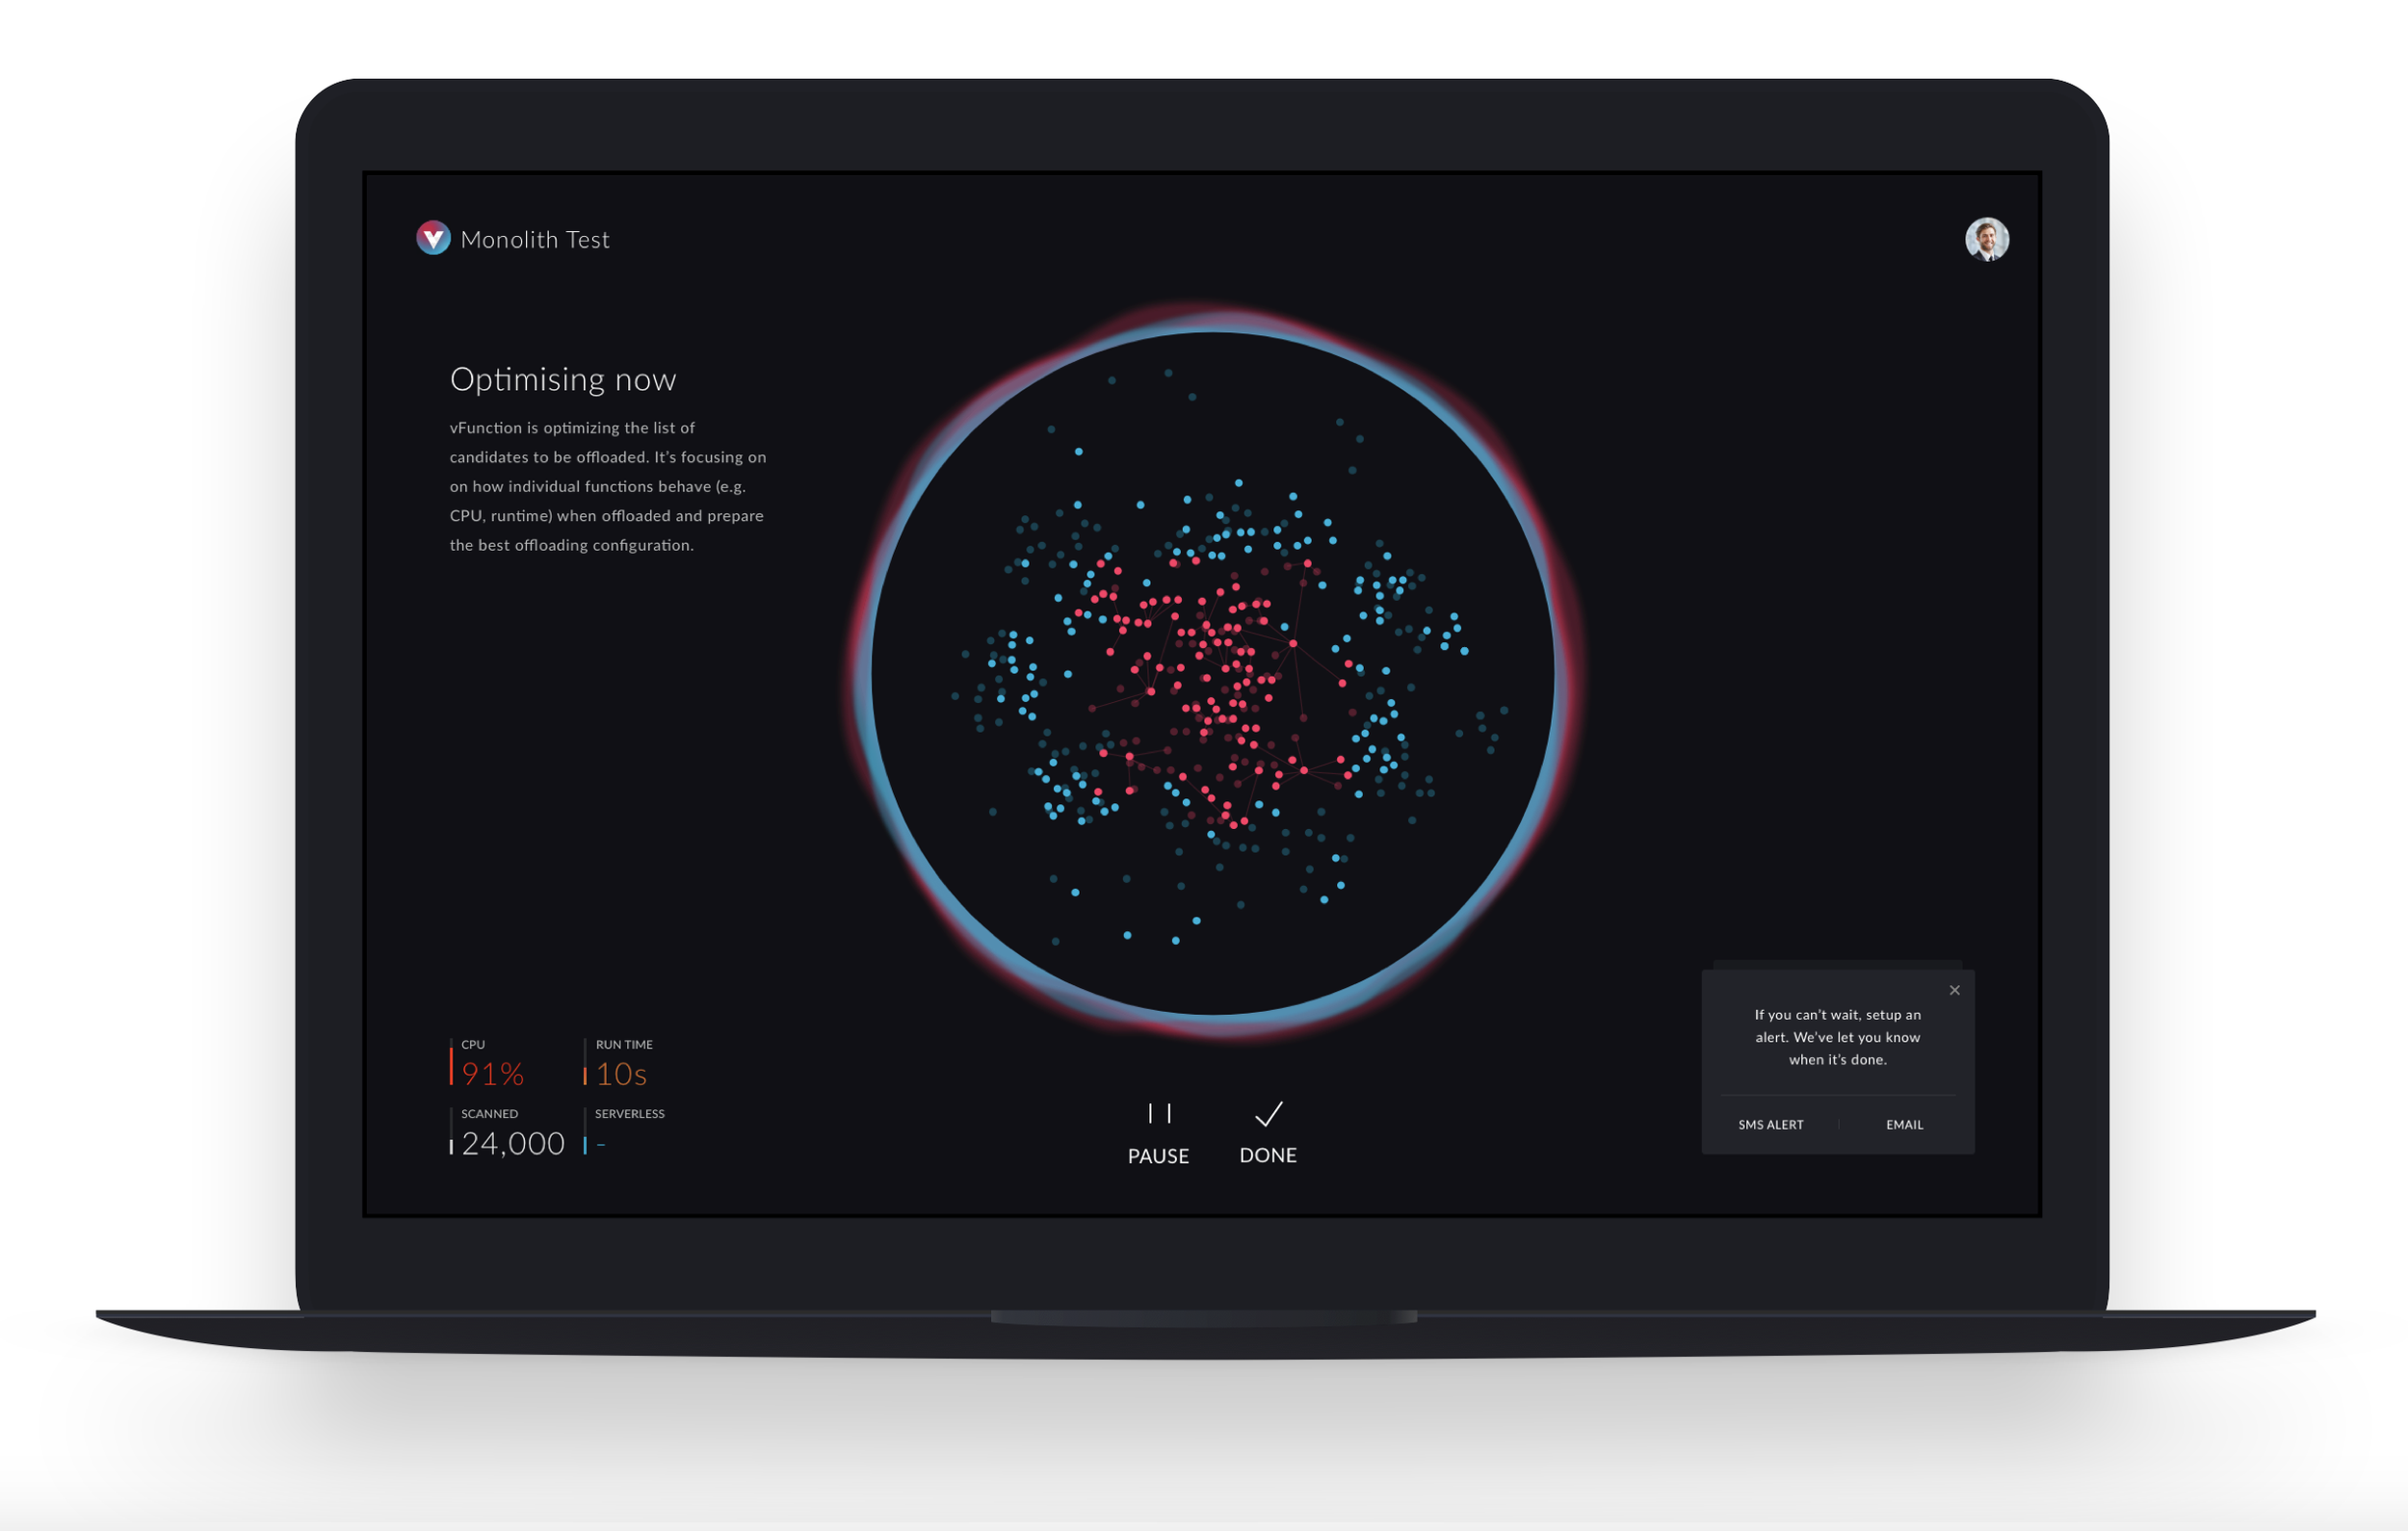
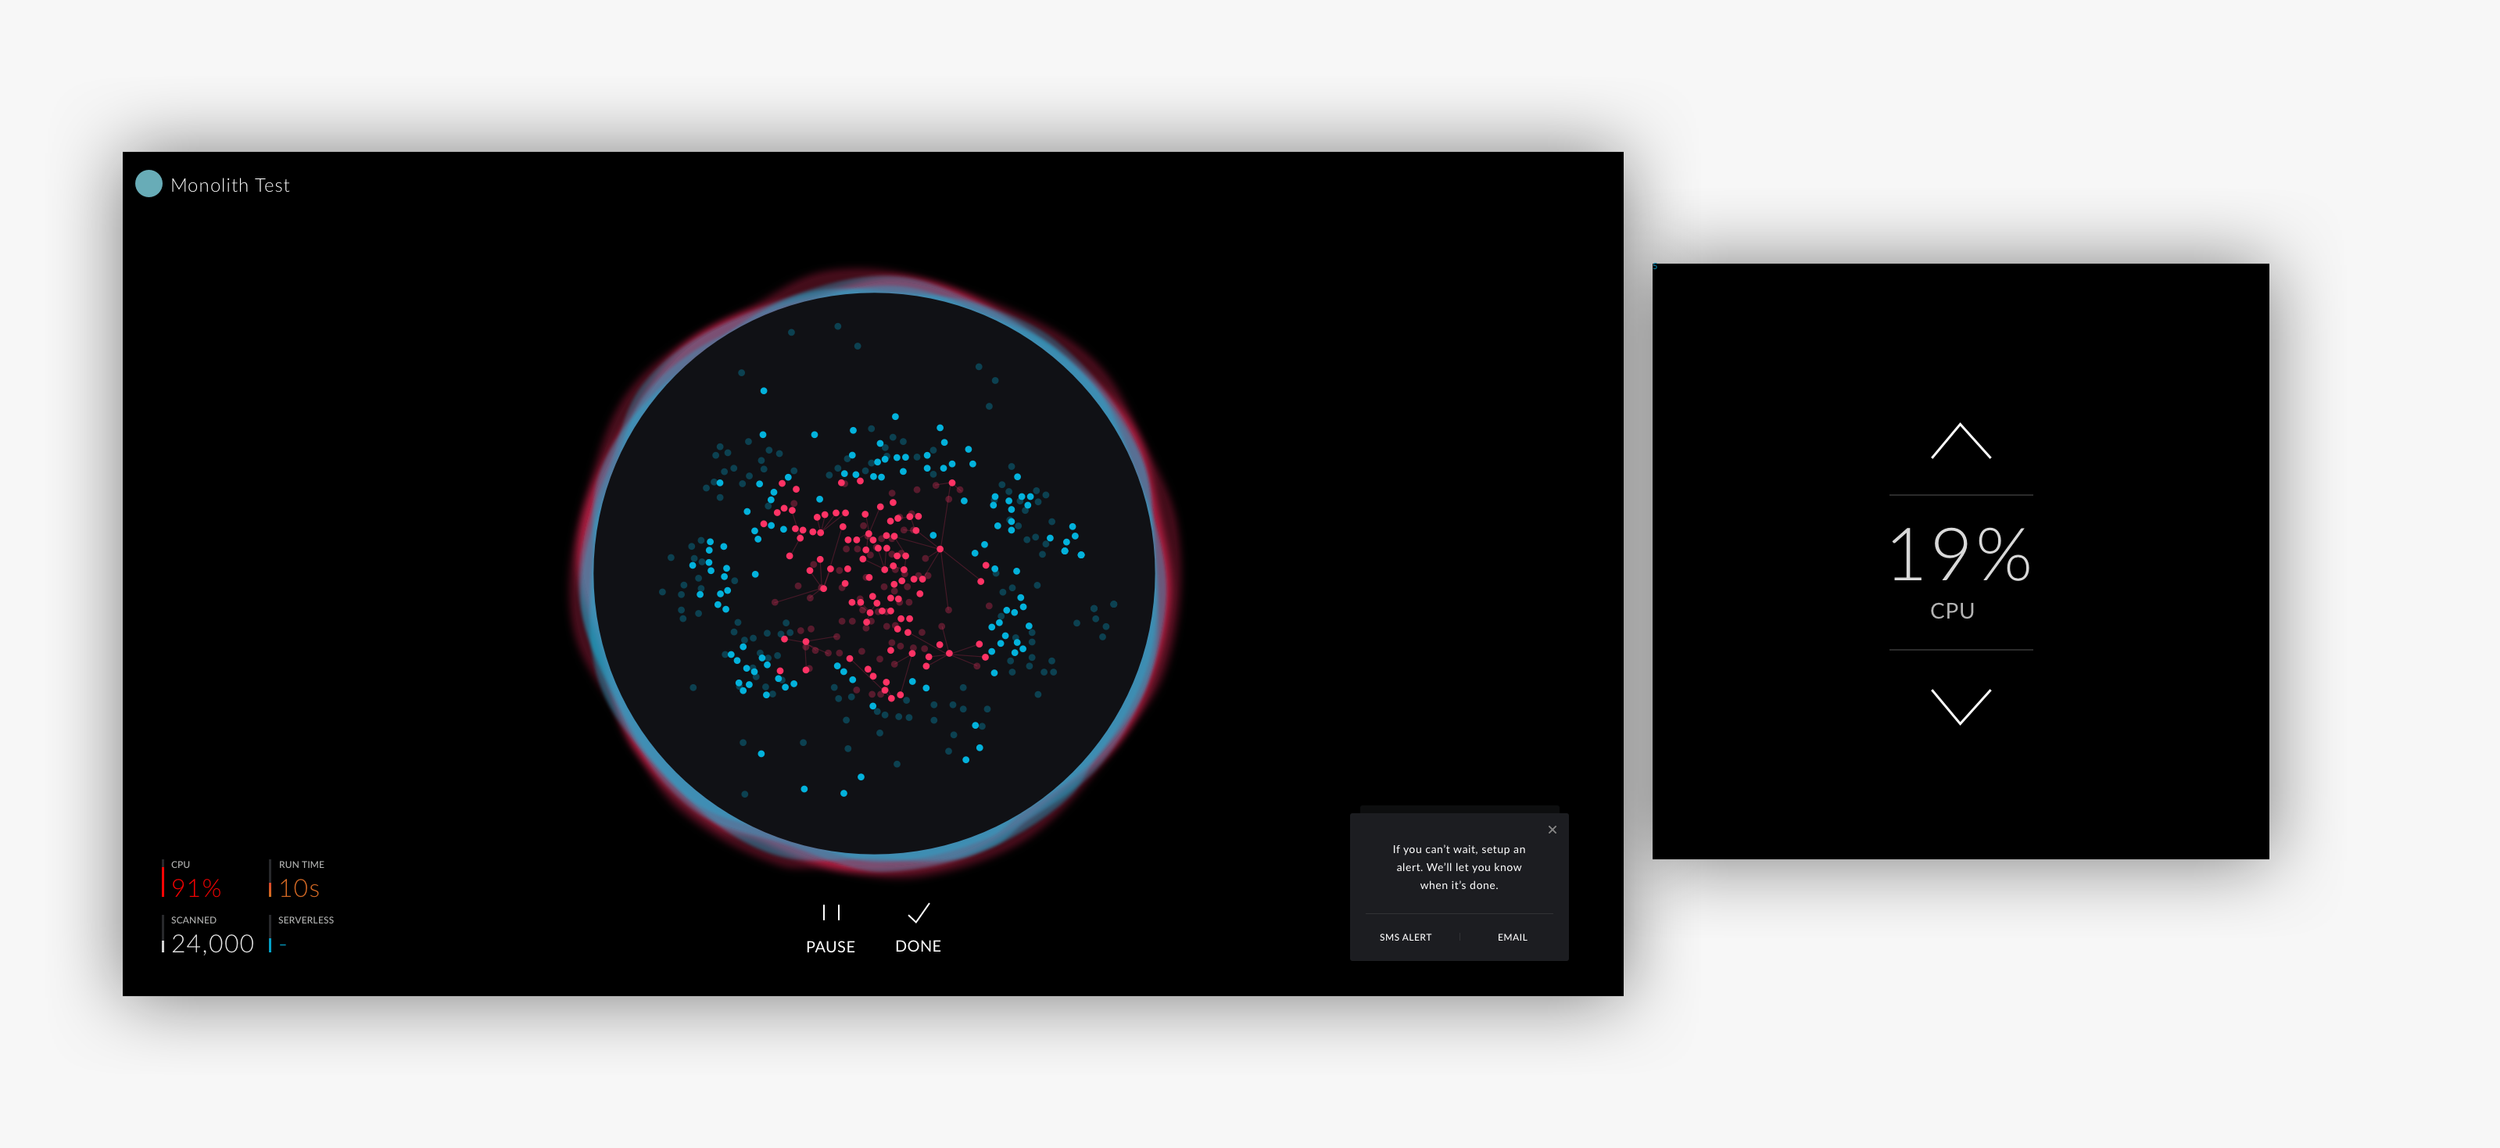
Onboarding experience: replaced static loading with animated, real-time visualisations of code analysis
Frictionless trial flow: email signup → connect codebase → live AI analysis in minutes
Tablet-first UI: flexible, demo-friendly for on the go meetings and pitches
ImpactRaised $2.2M in seed funding, post MVP launch
Earned top-tier recognition:
Named to CRN’s 2024 “Coolest Cloud Software Companies” list.
Finalist in both DevOps Excellence Awards and DevOps Dozen.
Named a Gartner Cool Vendor in AI-Augmented Development and Testing
Results: In just 12 weeks, your design enabled vFunction to go from backend-only tech to an award-winning, VC-backed product, dramatically improving investor pitches, user engagement, and market positioning.
Discovery sprint
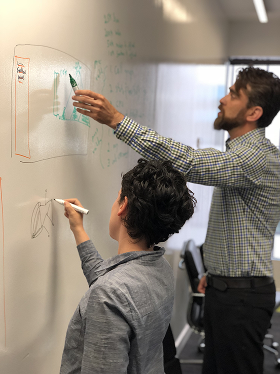
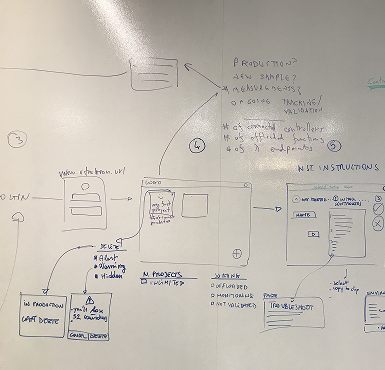
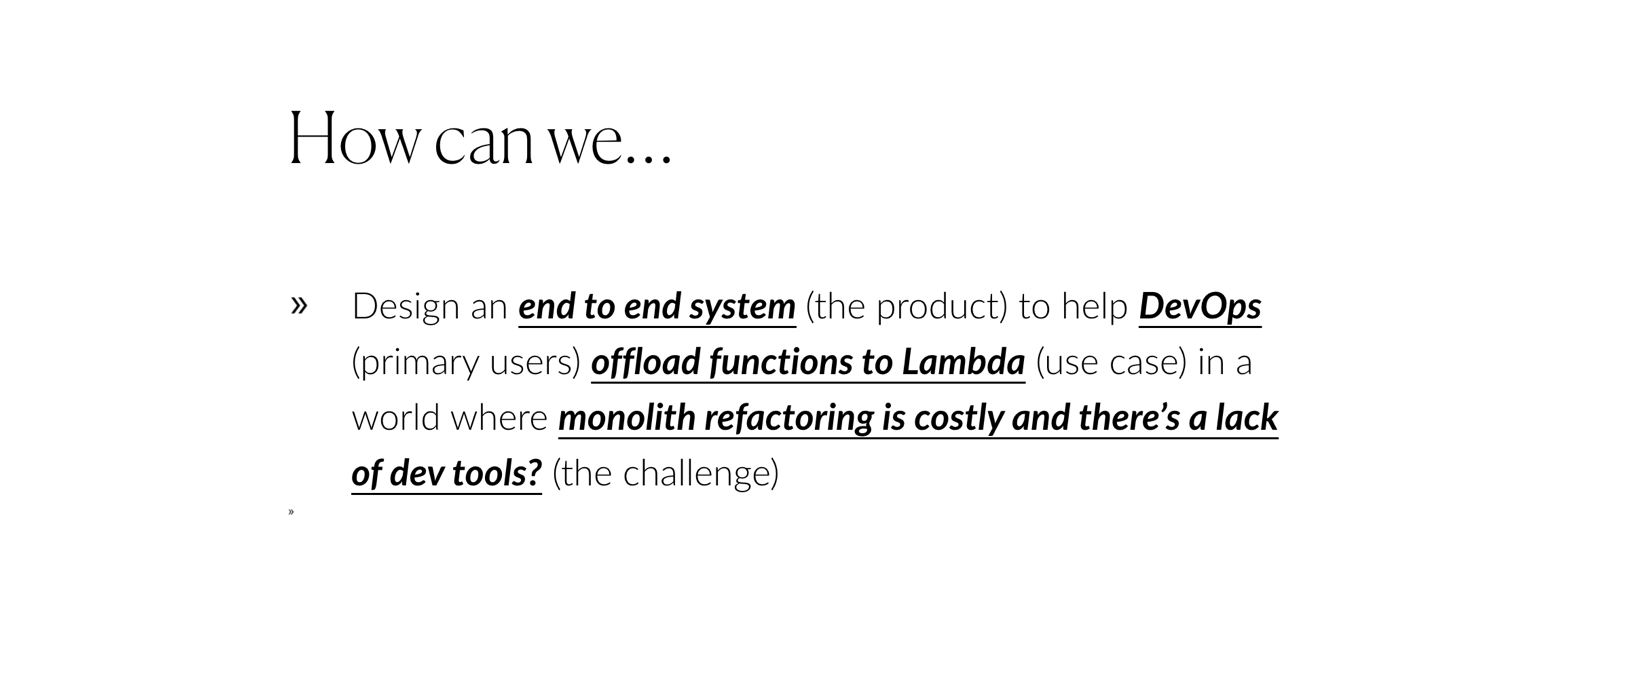
We launched with a focused one-week discovery sprint. Through whiteboard exercises and collaborative workshops, I worked to achieve two critical goals: clarify the business value proposition and distil the core challenge into a sharp "How might we..." problem statement.
The sessions revealed a common startup challenge: the engineering team's brilliant technical solution was trapped in highly technical language. While perfectly accurate, their messaging alienated the very audiences they needed to reach: DevOps teams who would use the product daily, CIOs who would approve budgets, and investors who would fund growth.
Our path forward became clear: design an interface that made complex cloud migration feel approachable rather than intimidating. We needed to transform their "tech-heavy" proposition into something engaging, intuitive, and yes, even enjoyable to use.
Profiling the user base: the dual audience dilemma
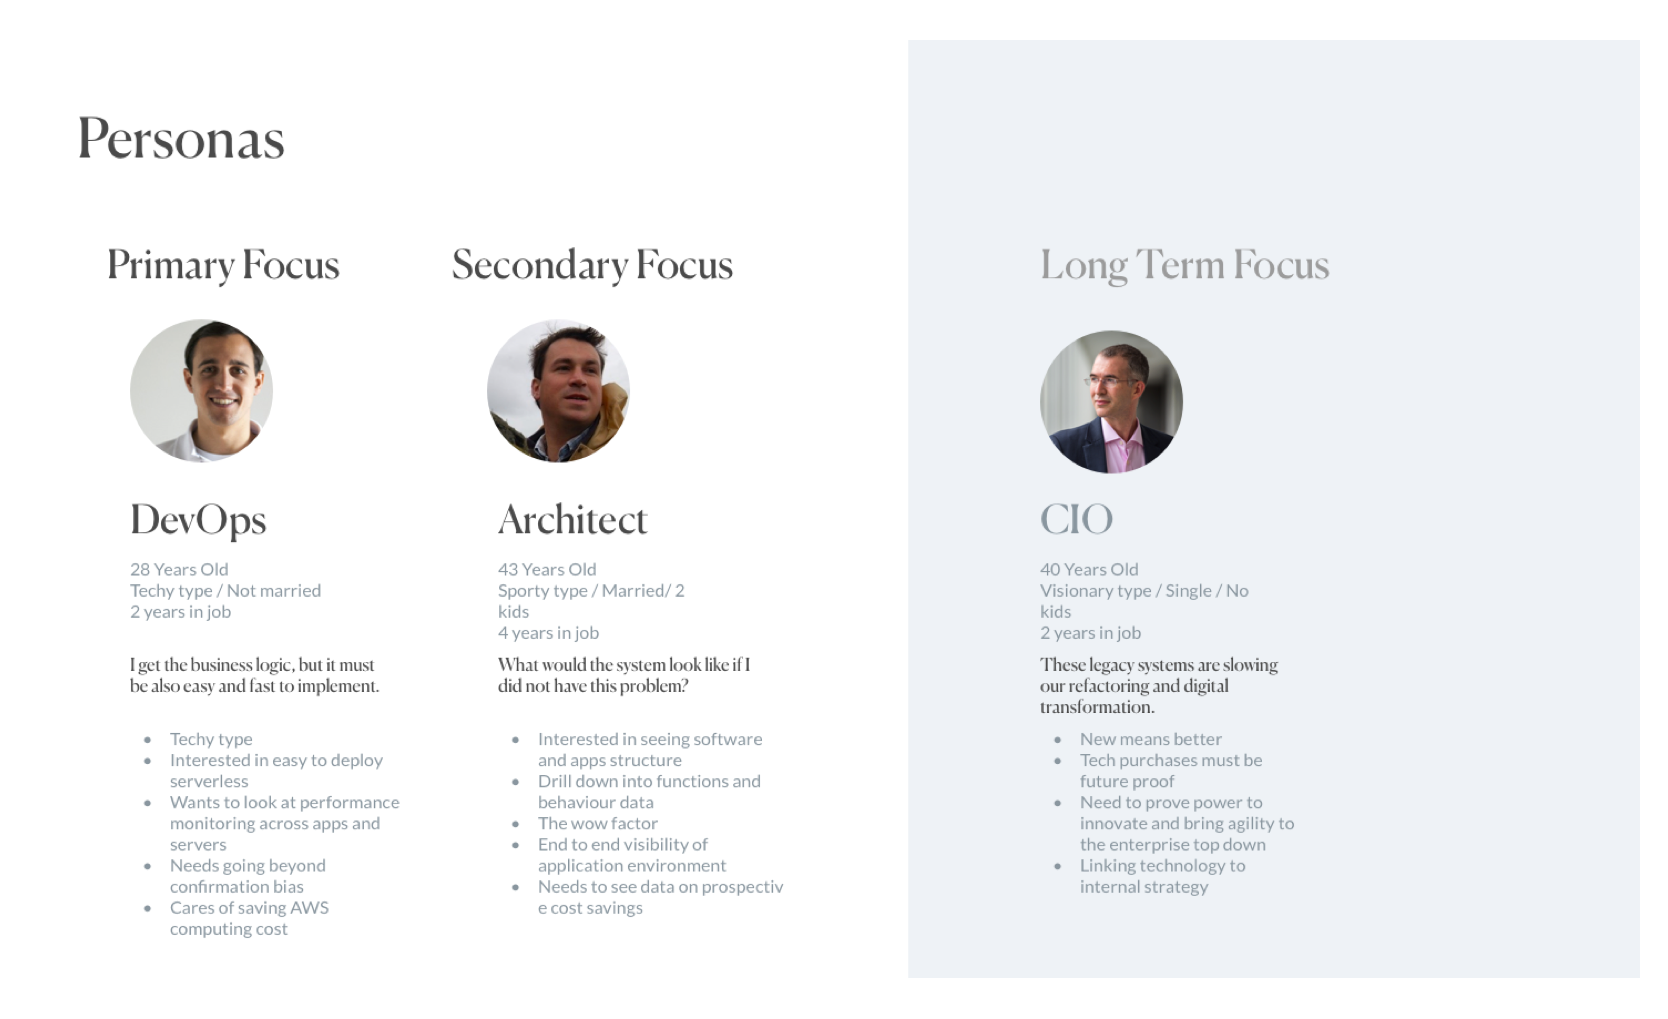
Our discovery sessions painted a clear picture of two very different worlds. DevOps engineers were dealing with the daily reality of legacy code, they knew modernisation was necessary and frankly, it would look good on their resumes too. But the people writing the checks? Business leaders juggling tight deadlines and even tighter budgets, desperate to ship faster while spending less.
The irony wasn't lost on us: the people who'd never touch our interface were the ones who'd decide whether to buy it. These business leaders spoke fluent P&L but saw code as mysterious hieroglyphics. They trusted their technical teams but couldn't personally evaluate whether a migration tool was worth the investment.
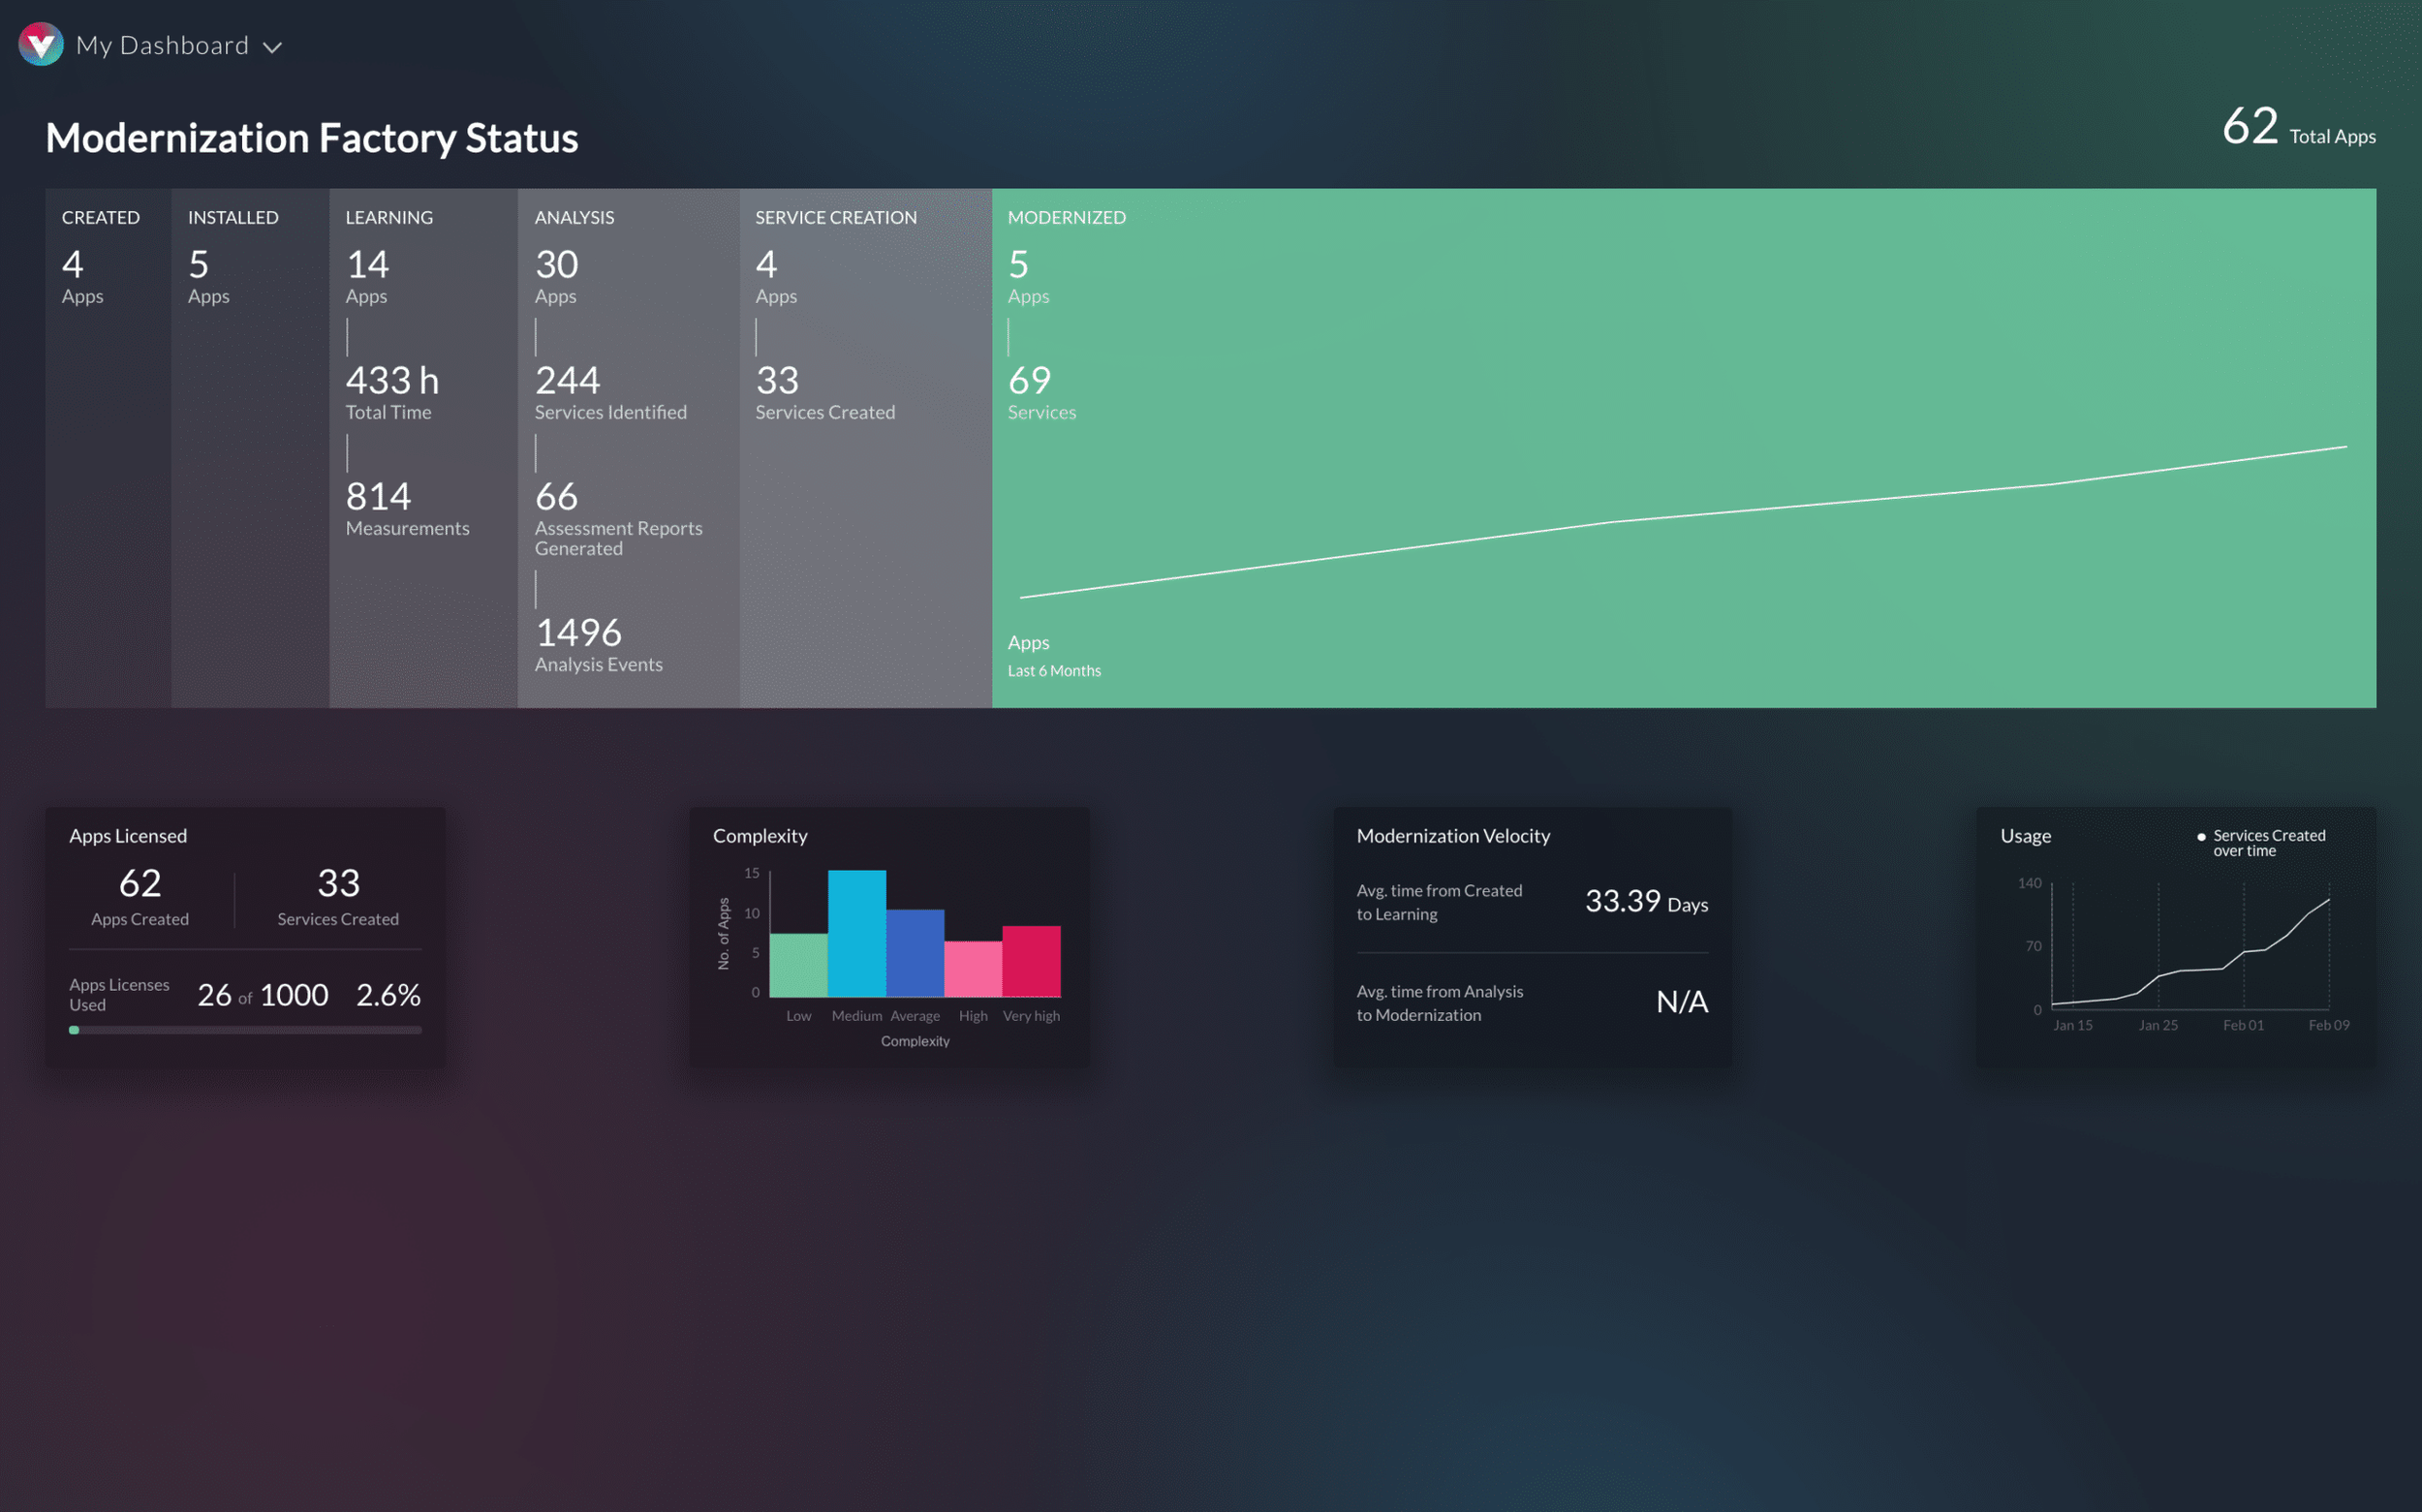
This created our biggest design challenge: how do you make something as abstract as "code complexity" feel tangible to someone who's never written a line of code? We needed to transform technical bottlenecks into something a CFO could point to in a meeting and say, "This is why we're moving too slowly, and here's how we fix it."
Mapping the app architecture
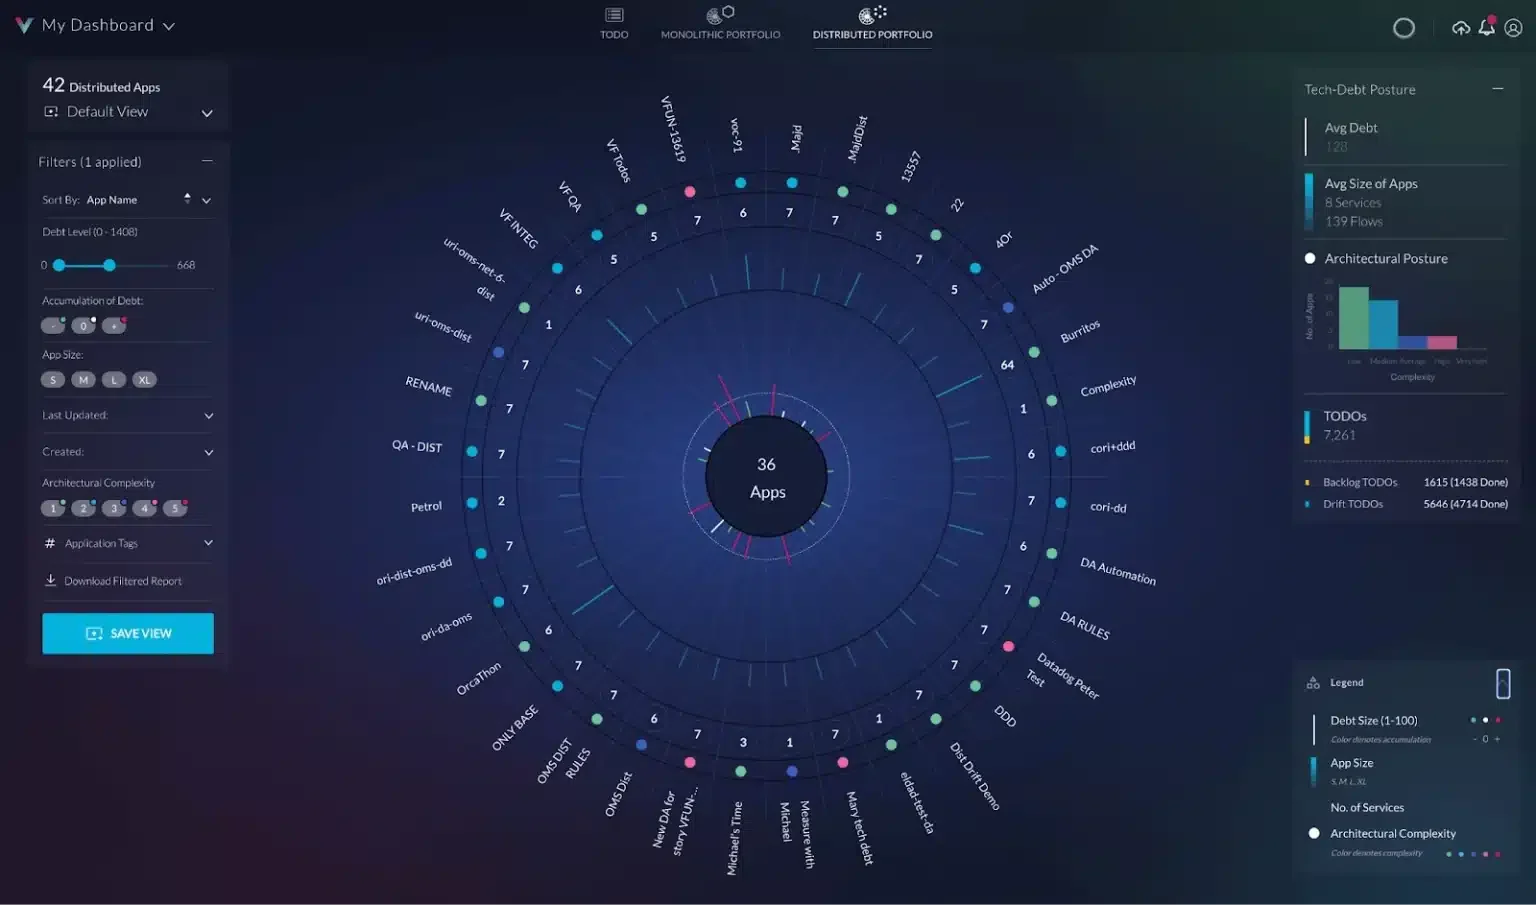
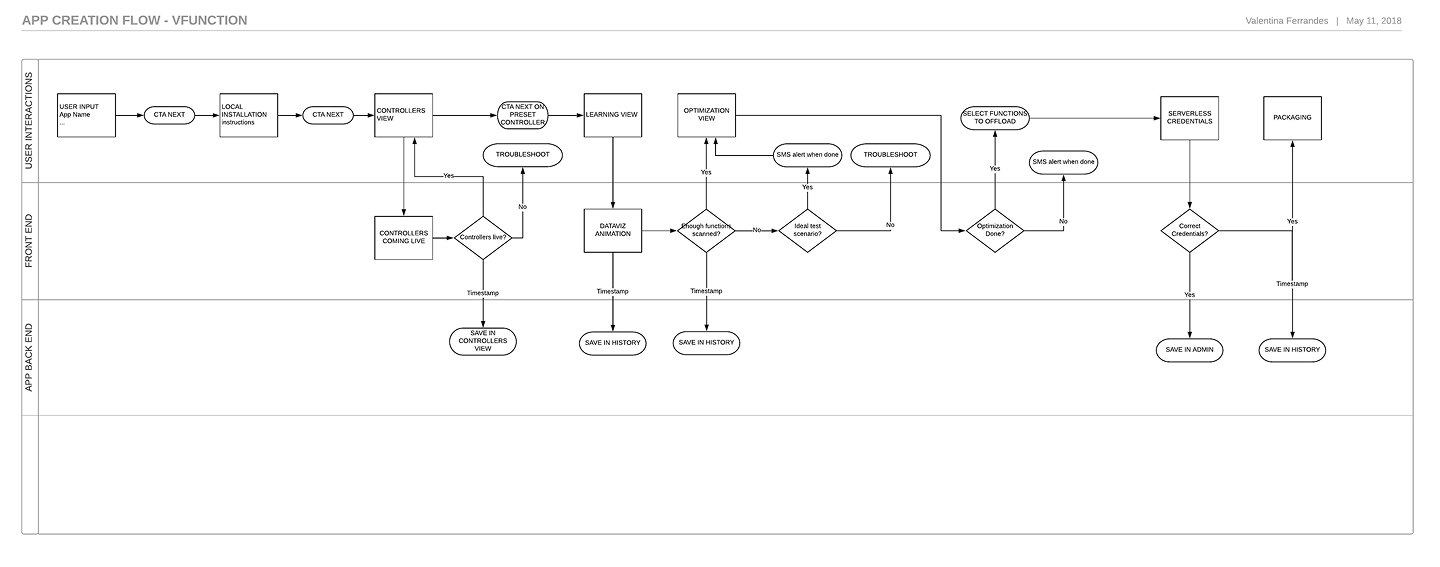
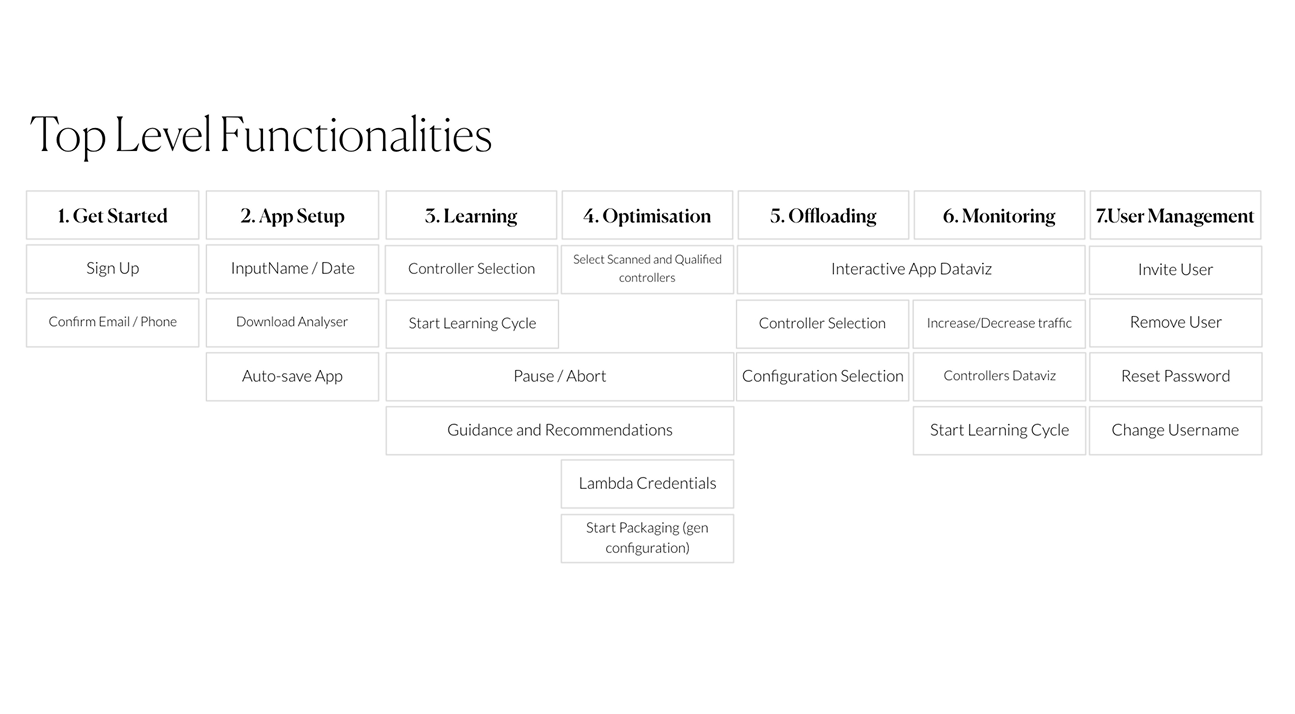
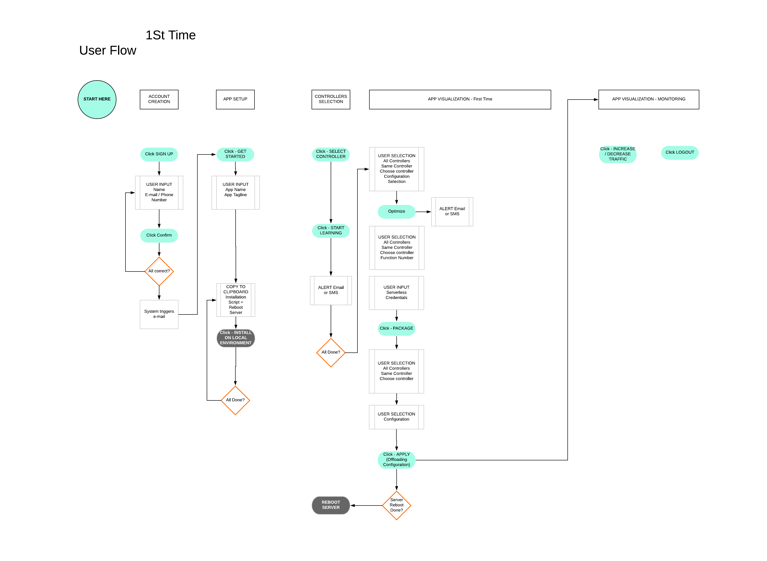
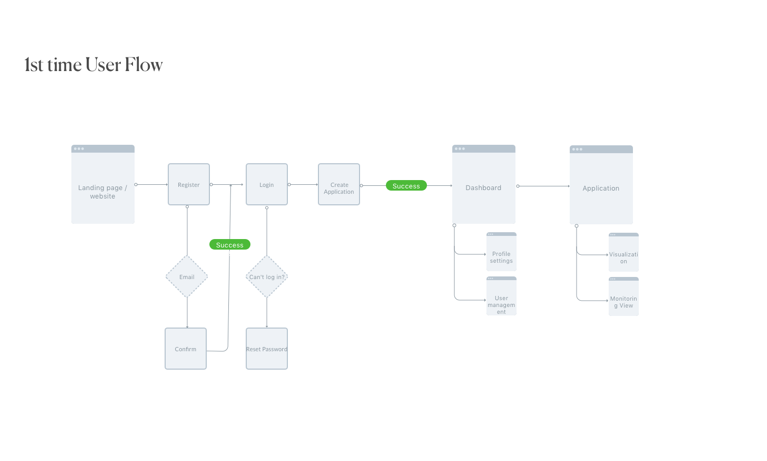
We had our target: a live dashboard where complex code analysis became instantly visual and actionable. To get there, I started with the foundations—mapping application architecture and user workflows to understand exactly how data would move through the system and land in front of our two very different audiences.
Strategic MVP: Building a Sales-Driven Demo
Next came the critical question: what's the minimum we could build that would still wow potential customers? Our MVP strategy was simple but powerful, let people experience the magic firsthand.
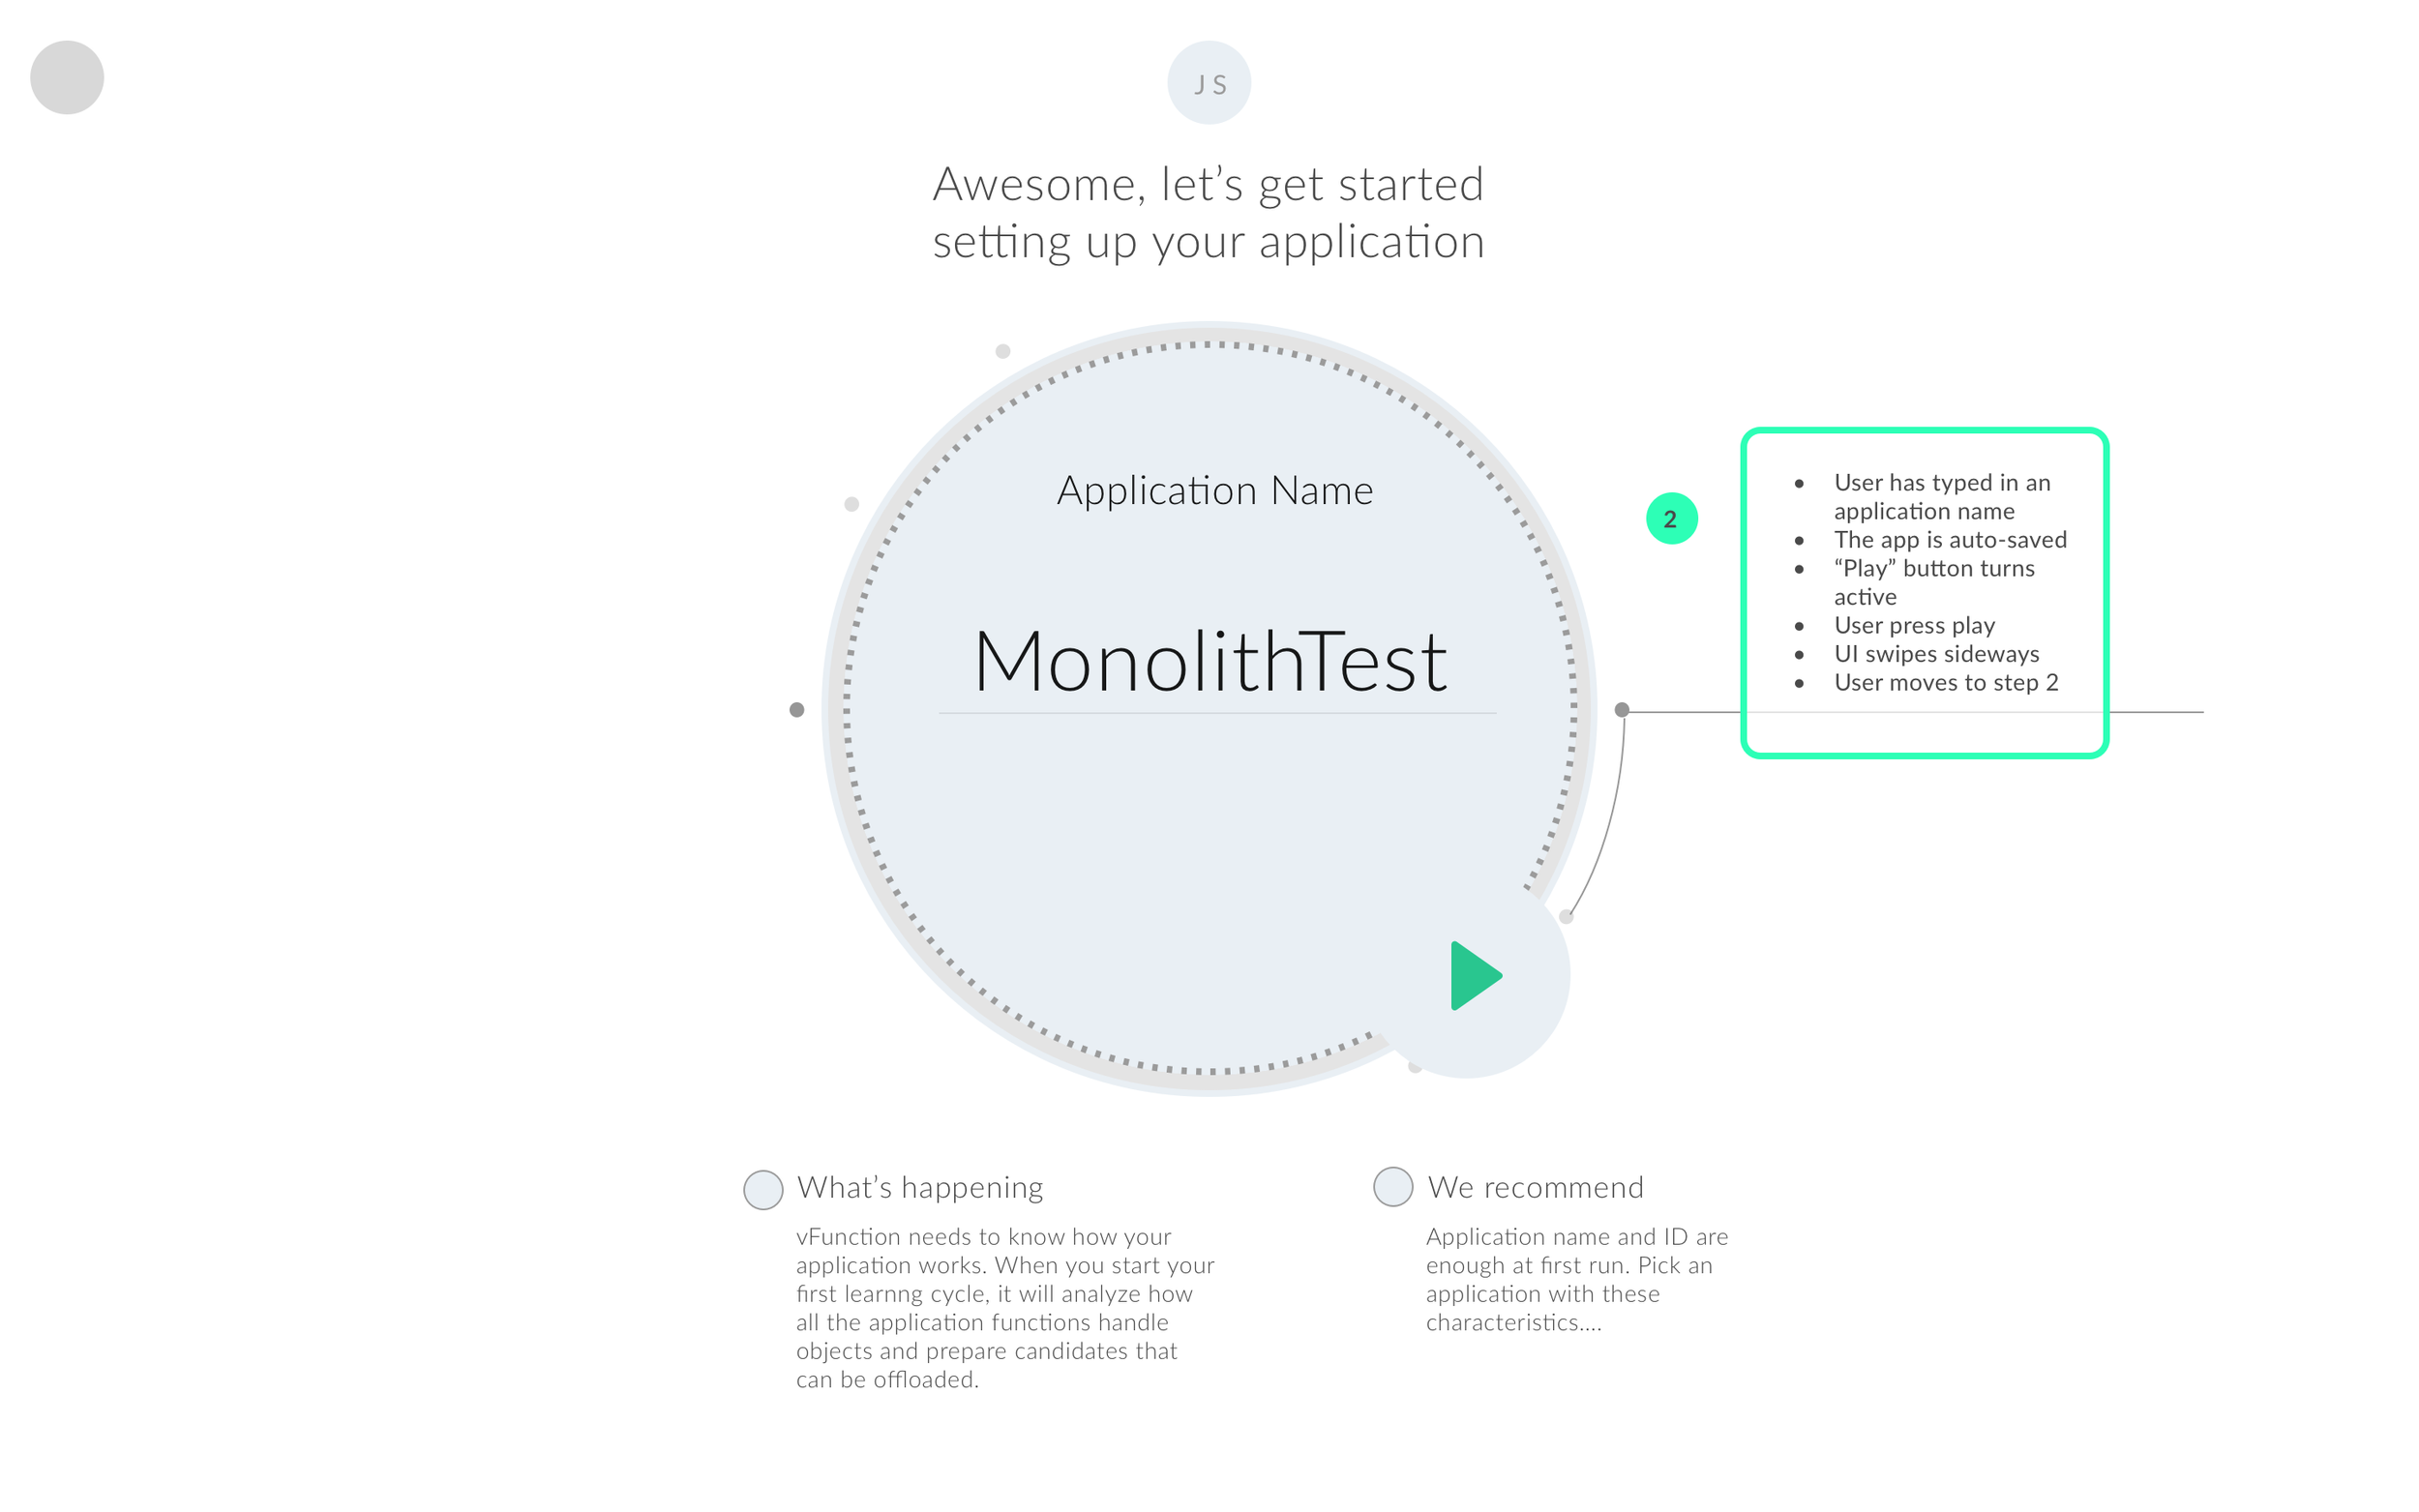
We designed a frictionless trial flow: users could register with just an email, connect their codebase in minutes, and watch our AI analyze their software in real-time. For a limited period, they'd get to see exactly what vFunction could do with their actual code, not some generic demo.
This approach solved multiple challenges at once. Business leaders got concrete proof of value they could understand and share with their teams. Meanwhile, the founders gained a pipeline of engaged prospects who had already experienced the product's impact, the warmest possible leads for follow-up conversations.
12 weeks roadmap to MVP
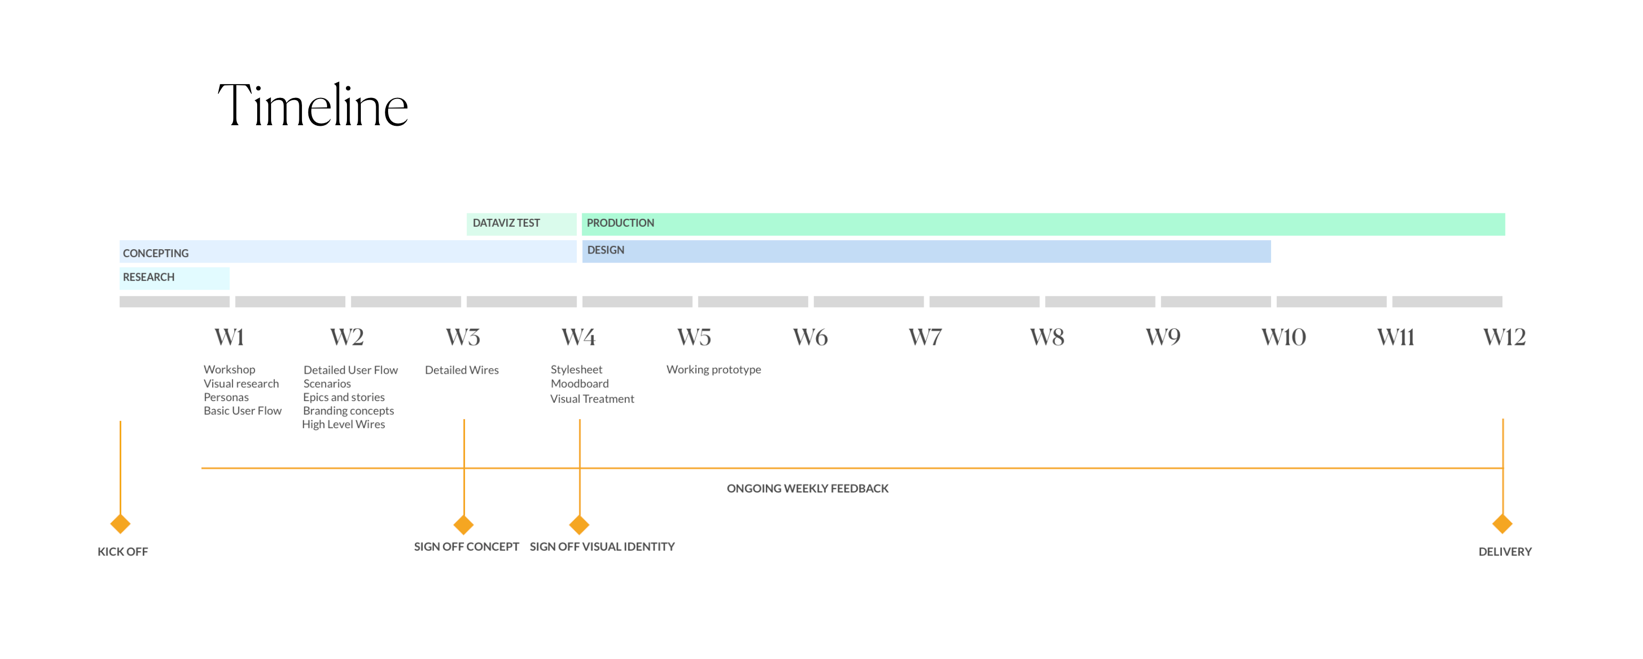
With our strategy locked in, I had to orchestrate a tight 12-week timeline that would take us from concept to functional demo. The first month was intentionally dual-tracked, while I developed the visual identity and brand language that would make vFunction feel approachable rather than intimidating, my team simultaneously built the core interface components. This parallel approach meant our design system and user experience evolved together, ensuring visual consistency from day one.
The remaining eight weeks shifted focus to the make-or-break challenge: proving our interface could handle real-world complexity. We moved from designing for hypothetical use cases to stress-testing against actual client codebases, iterating rapidly as we discovered edge cases and performance bottlenecks. Every week brought new technical constraints that required design solutions, balancing ambitious visualisations with the reality of what our backend could reliably deliver under tight deadlines.
Wireframes
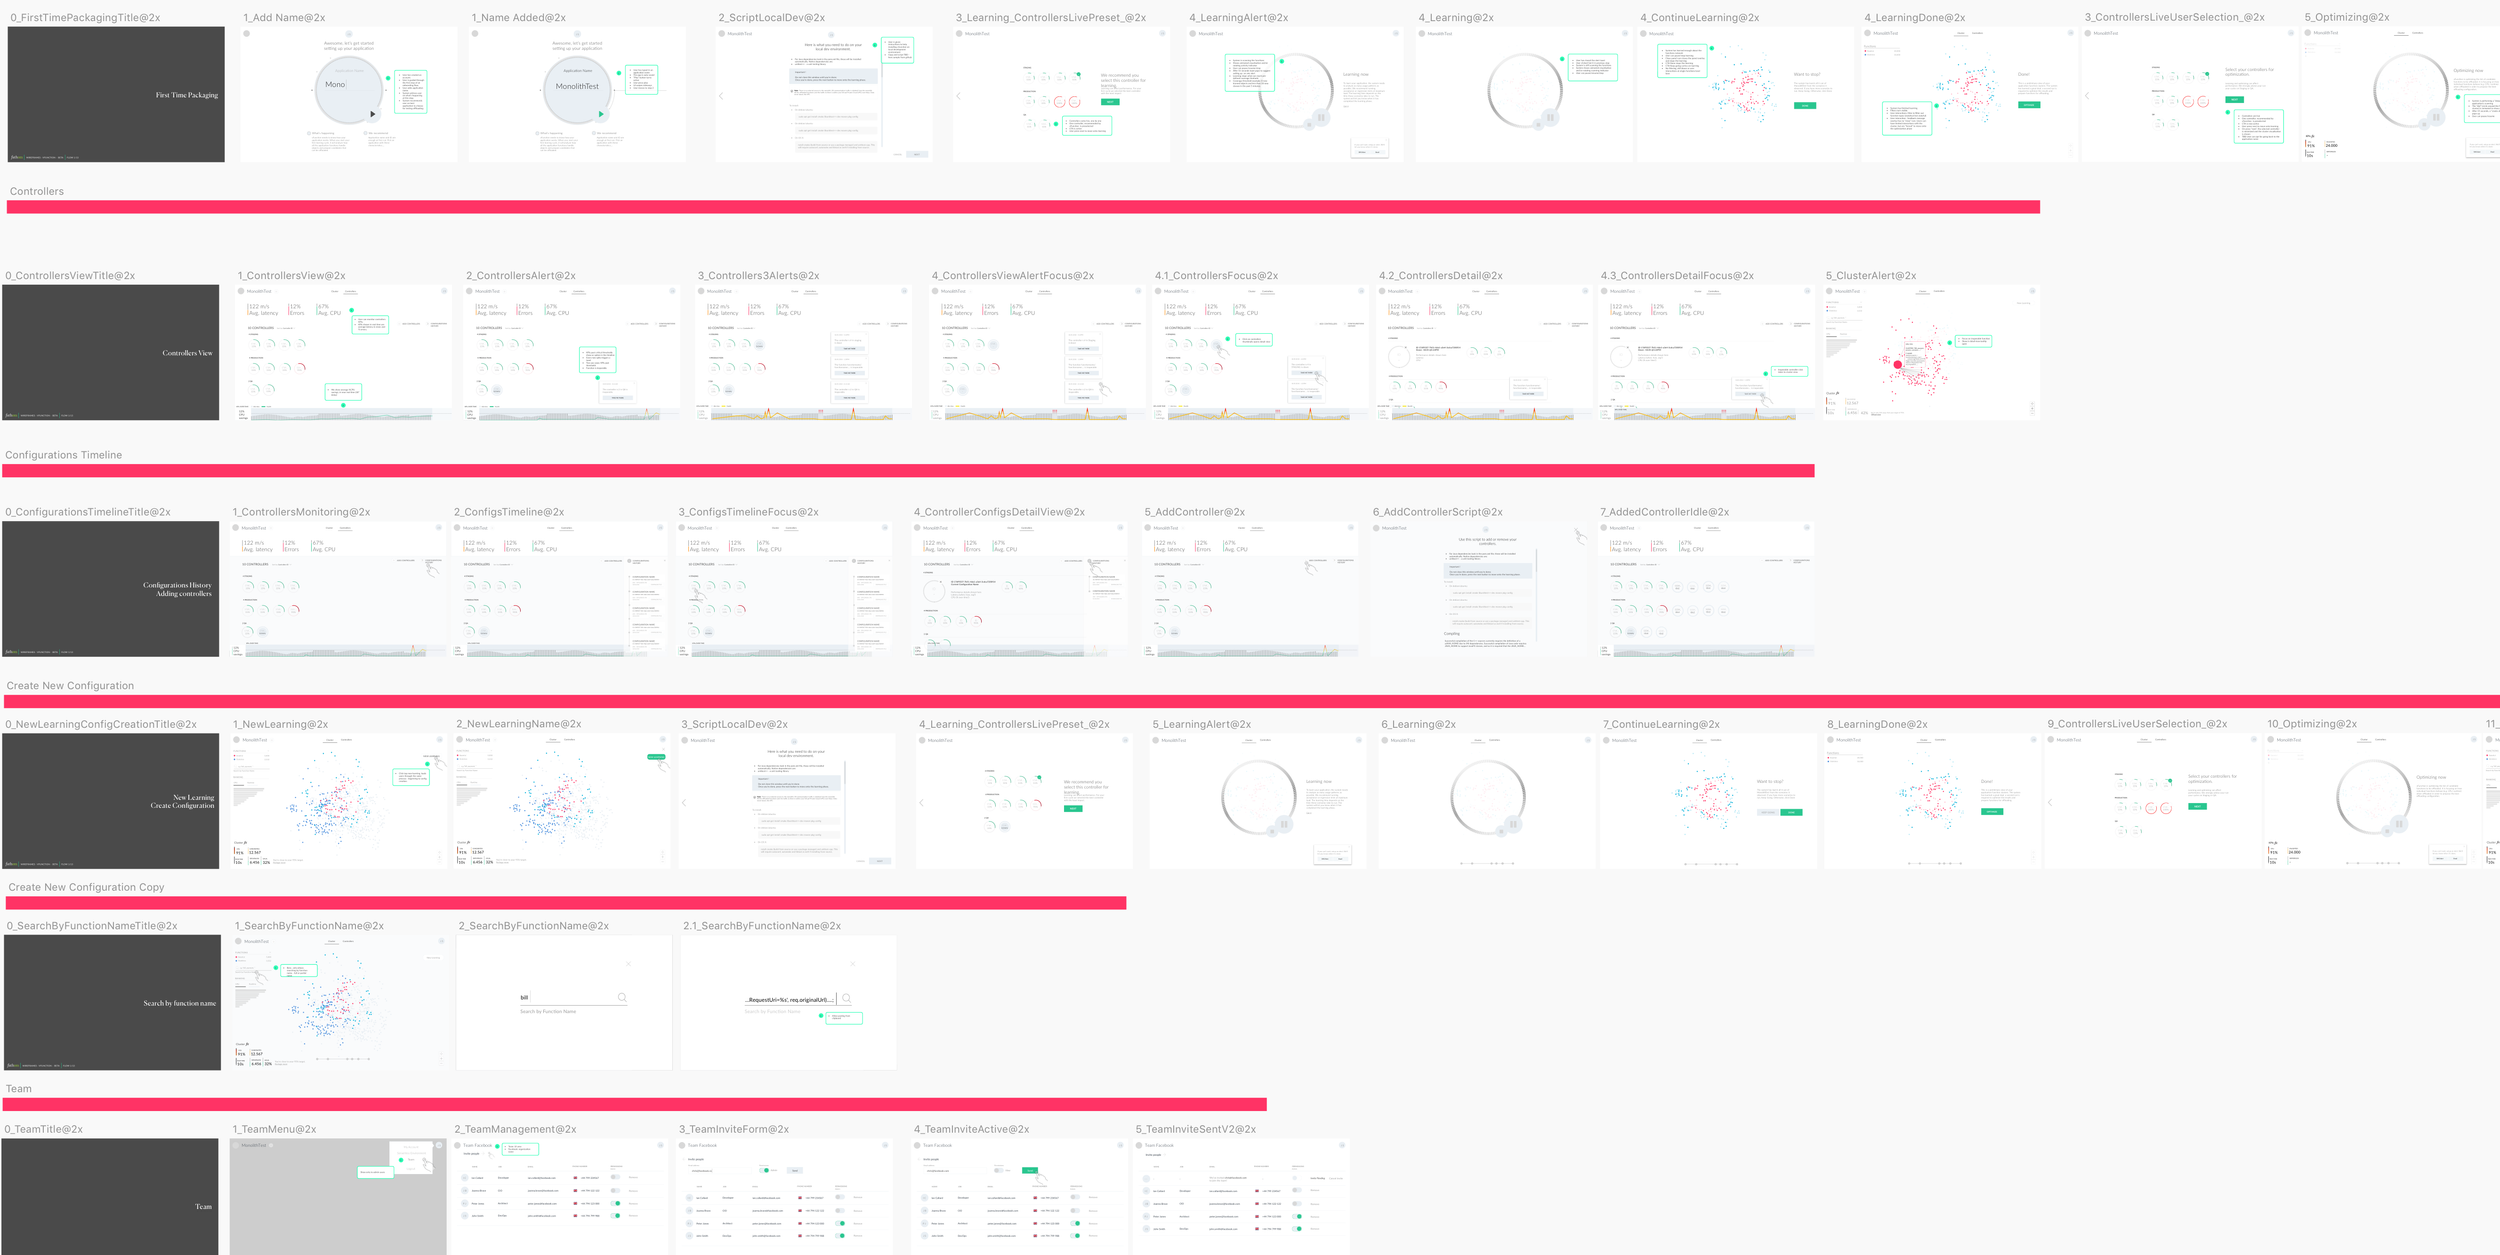
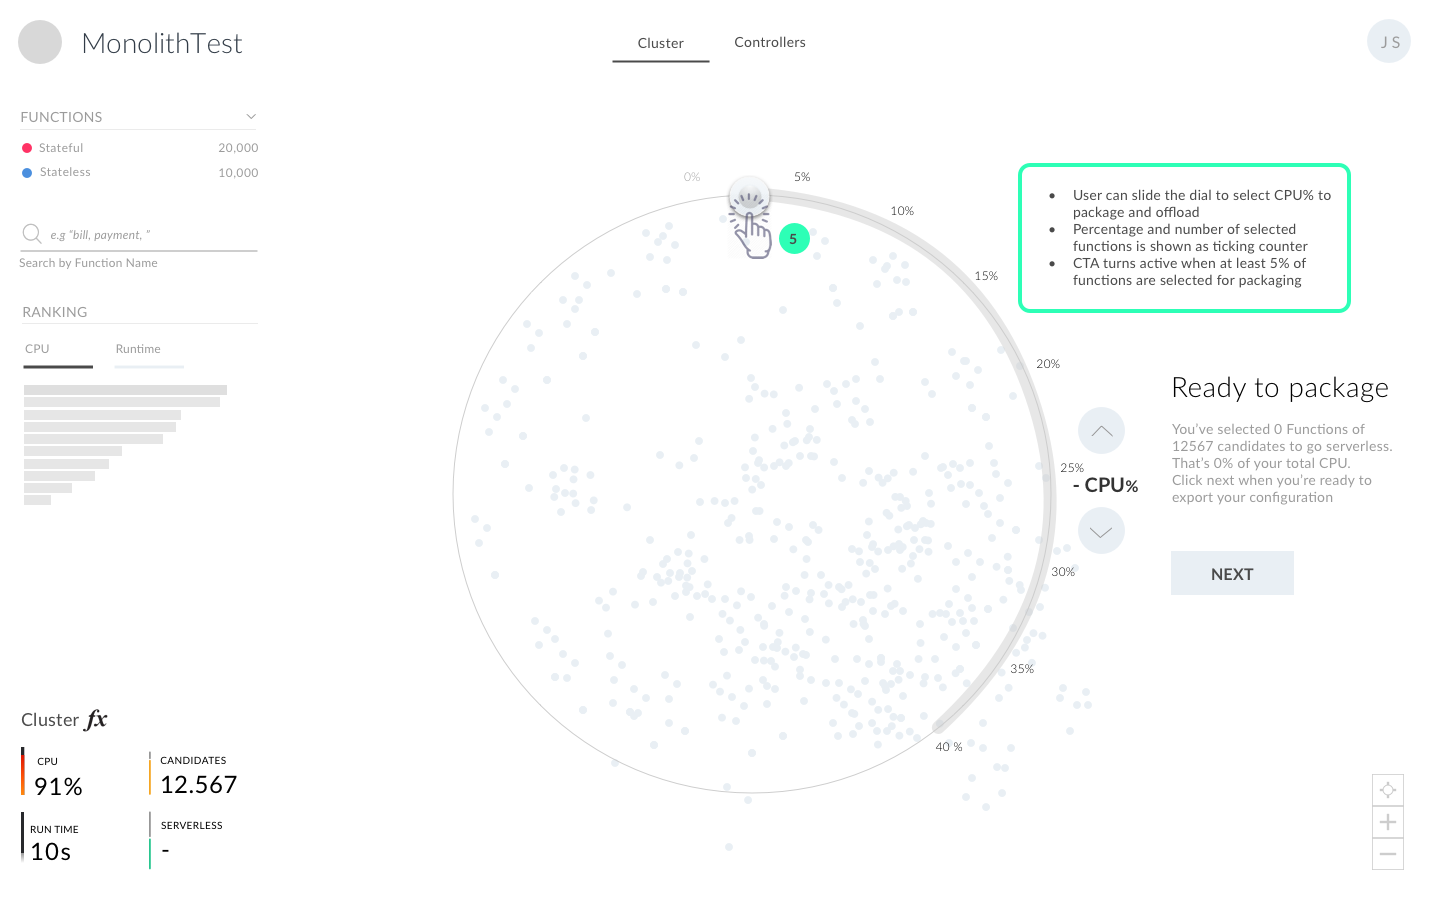
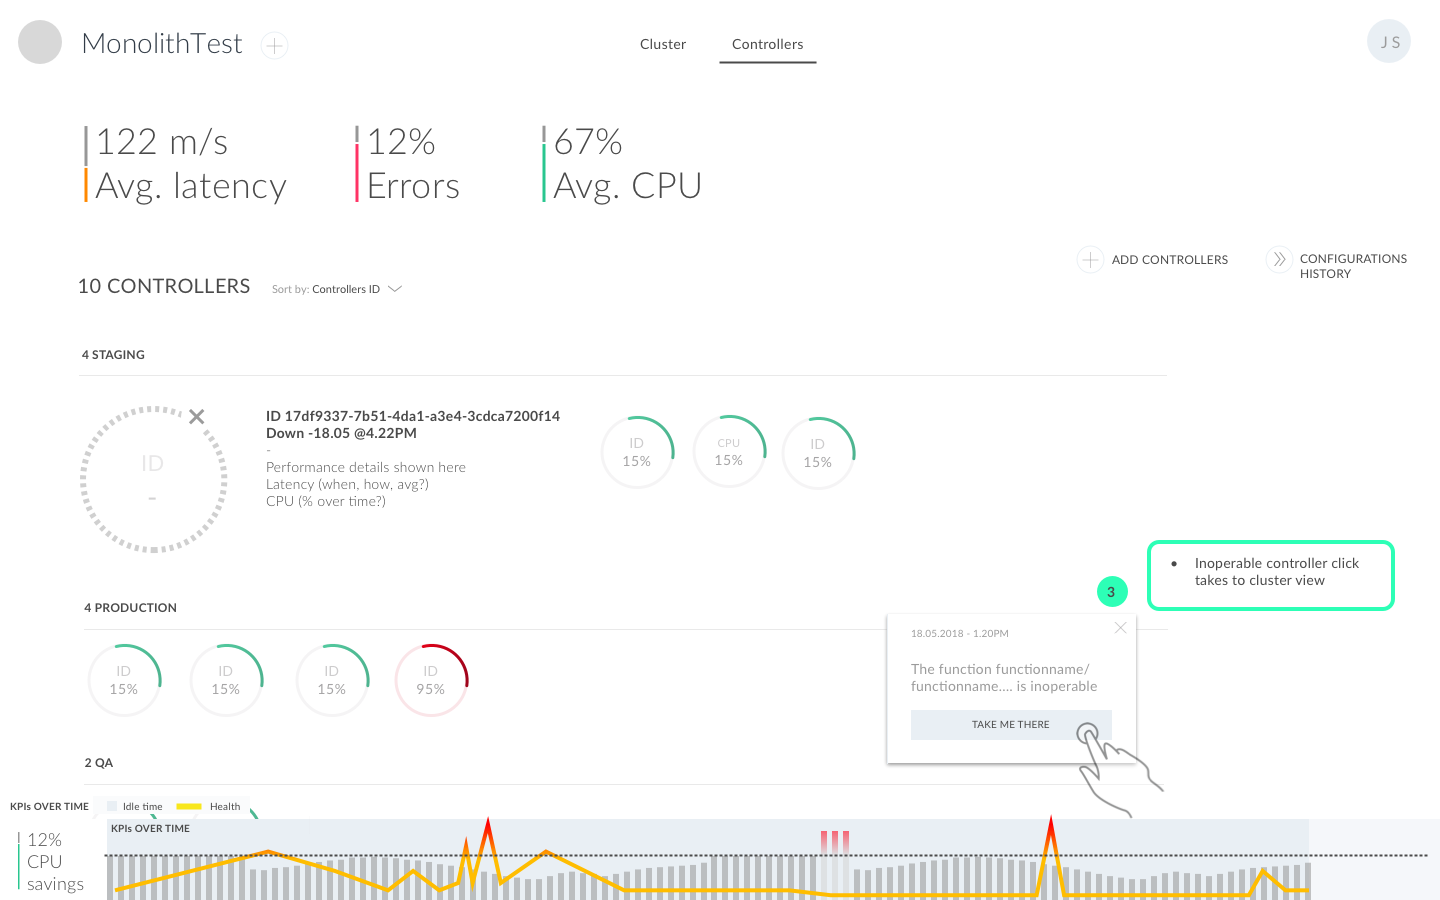
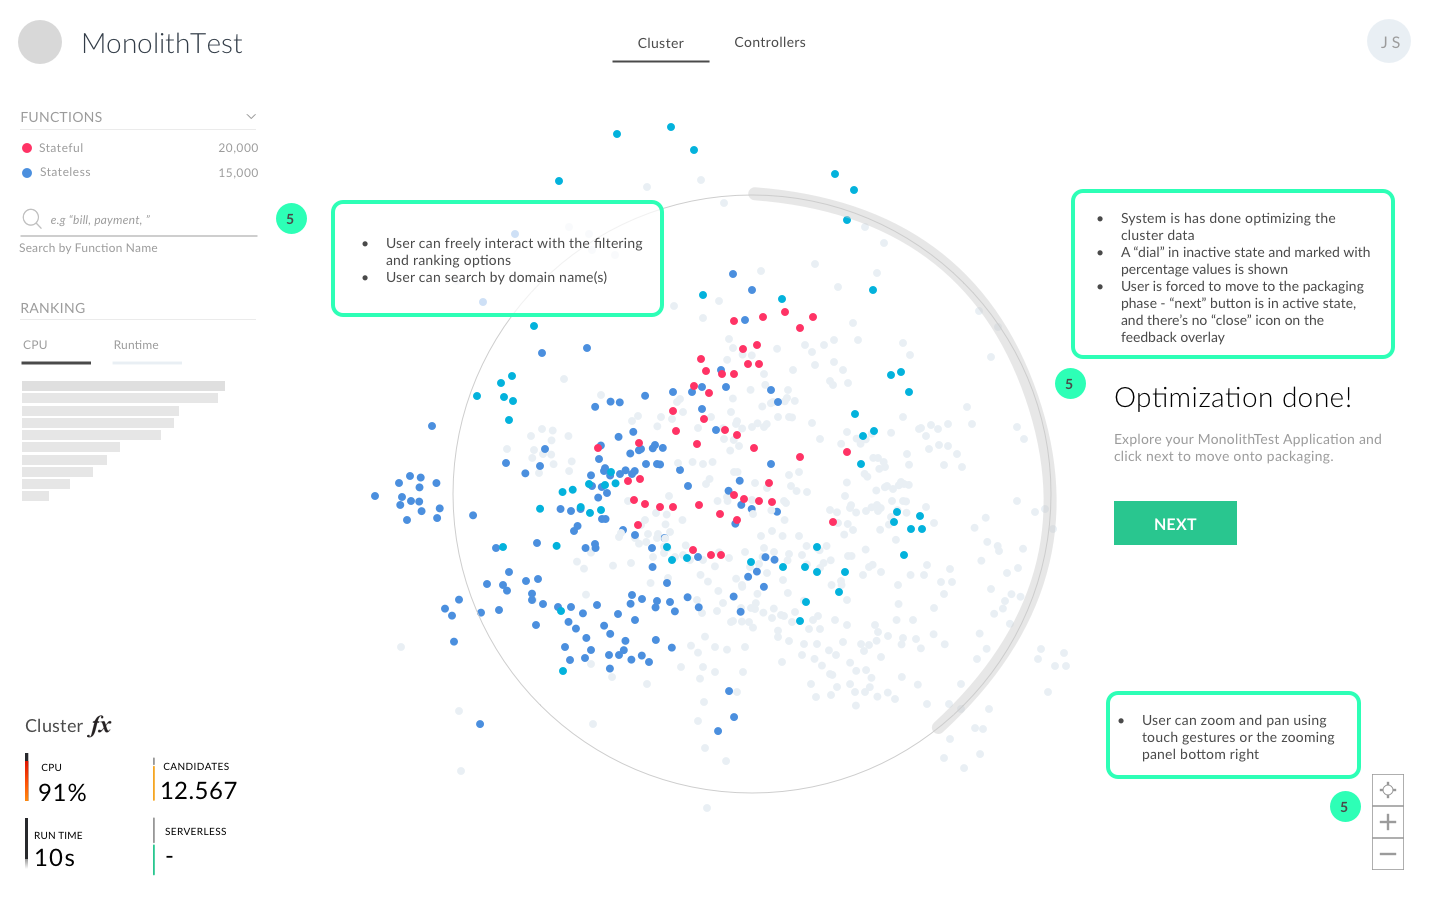
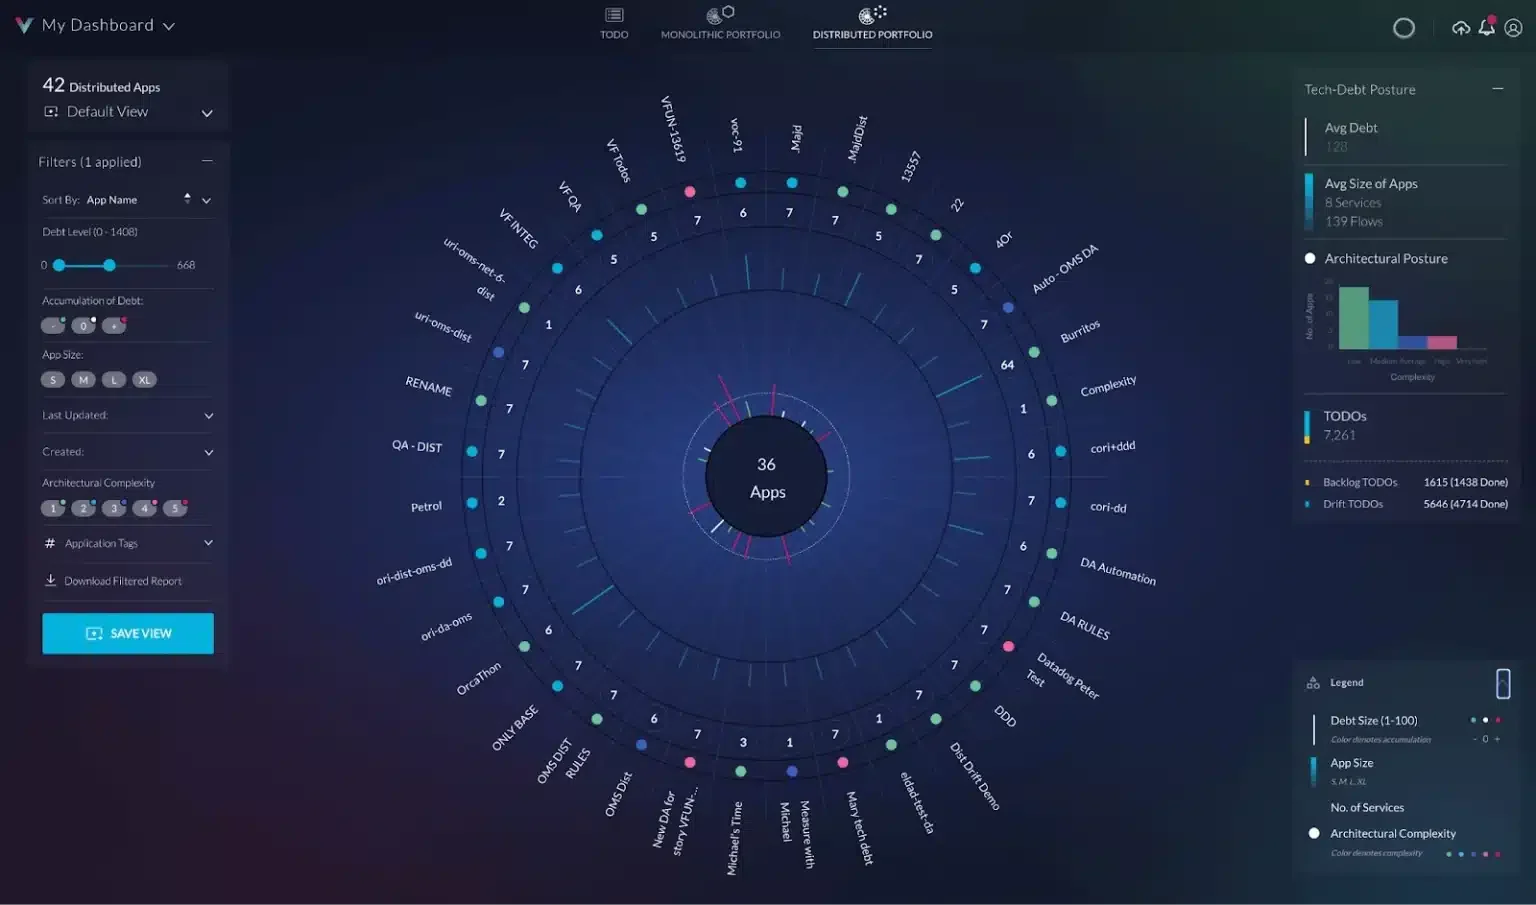
When it came to wireframing, I drew inspiration from an unexpected place: car cockpits and video game interfaces. I'd noticed that DevOps engineers and technical teams often had a passion for gaming, so why not borrow from those paradigms? Instead of another sterile corporate dashboard, I designed something that felt more like a command centre, engaging, intuitive, and dare I say it, actually fun to use. I optimised the UI for tablet-first, knowing that technical teams often preferred the flexibility of moving between devices and presenting findings in meetings on larger touchscreens.
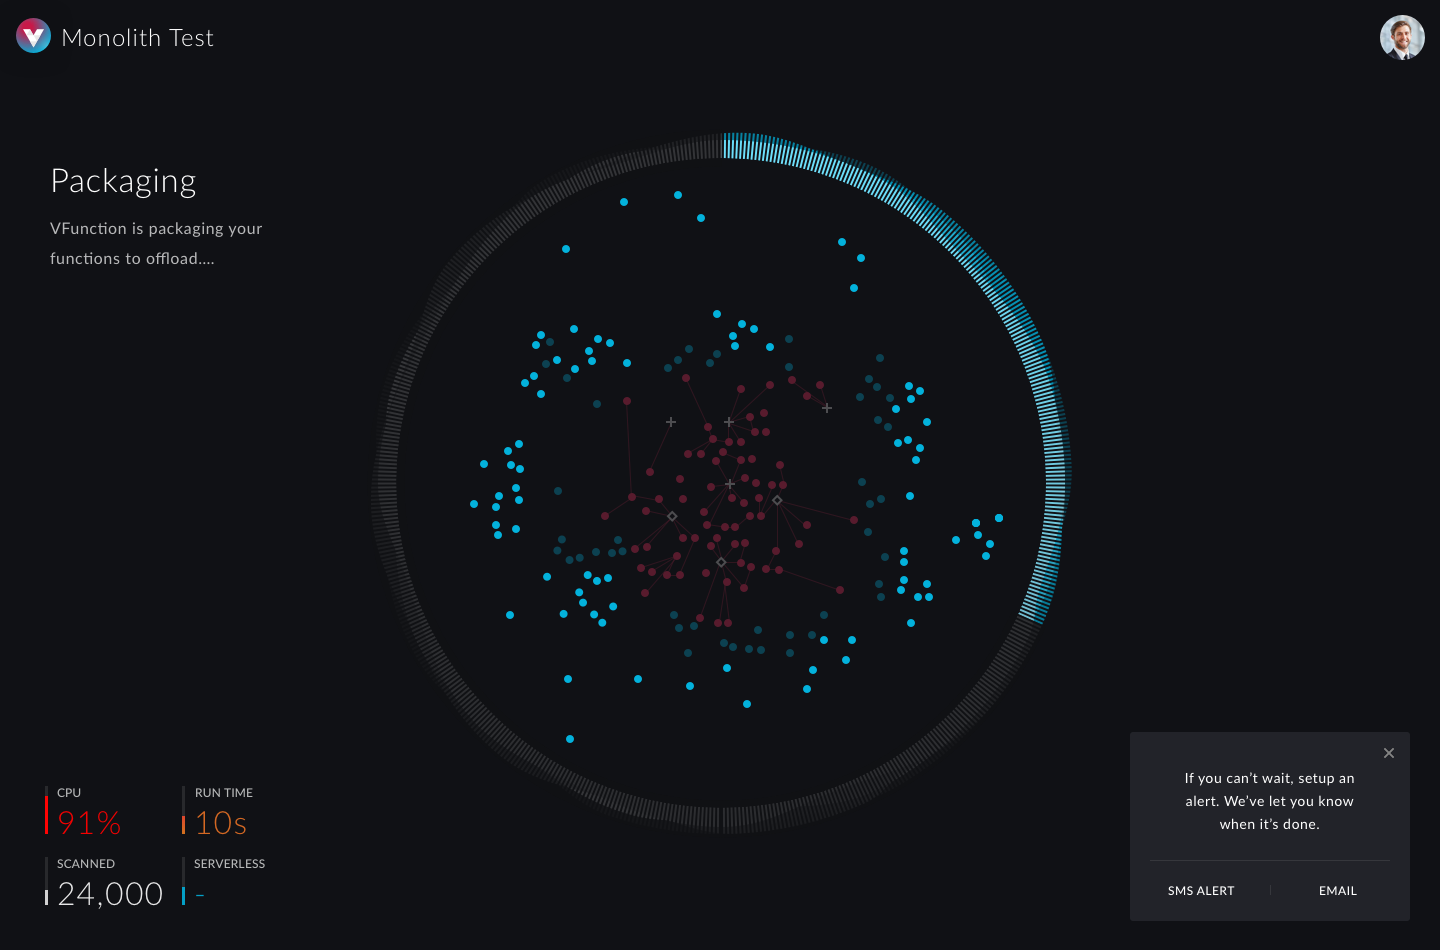
This approach became crucial when we hit our biggest UX challenge: the onboarding process. While our AI crawled through users' codebases for the first time, they faced a potentially lengthy wait, exactly the kind of friction that kills conversion rates. Rather than showing a static loading bar, we created a series of real-time animations that visualised what was happening under the hood. Users could watch their code being analysed, connections being mapped, and insights being generated. What could have been a frustrating wait became an engaging preview of the platform's capabilities, transforming a technical limitation into a compelling product demonstration.
Beyond the MVP
As we approached the end of our 12-week sprint, it became clear that we'd built something more substantial than initially planned. What started as a functional demo had evolved into a genuinely compelling product experience. The gaming-inspired interface wasn't just visually engaging, it was driving longer session times and deeper exploration of features. Users weren't just completing the trial flow; they were actively experimenting with different views, diving into code analysis details, and sharing insights with their teams.
The real validation came from user behaviour we hadn't anticipated. Business leaders who typically bounced from technical demos were staying engaged, asking detailed questions, and requesting extended trials. DevOps teams were treating the platform less like a demo and more like a tool they wanted to integrate into their daily workflows. We'd successfully bridged that gap between technical capability and business value, creating something that resonated with both audiences simultaneously. The MVP had become a proof of concept for the company's entire go-to-market strategy.
Results: Rapid Prototyping to Market-Leading Adoption
vFunction was founded with an ambitious vision: simplify software complexity through intelligent algorithms, intuitive interfaces, and accessible data visualisation. In just 12 weeks, our team at Fathom helped transform that vision into reality, a fully functional MVP ready for high-stakes demonstrations.
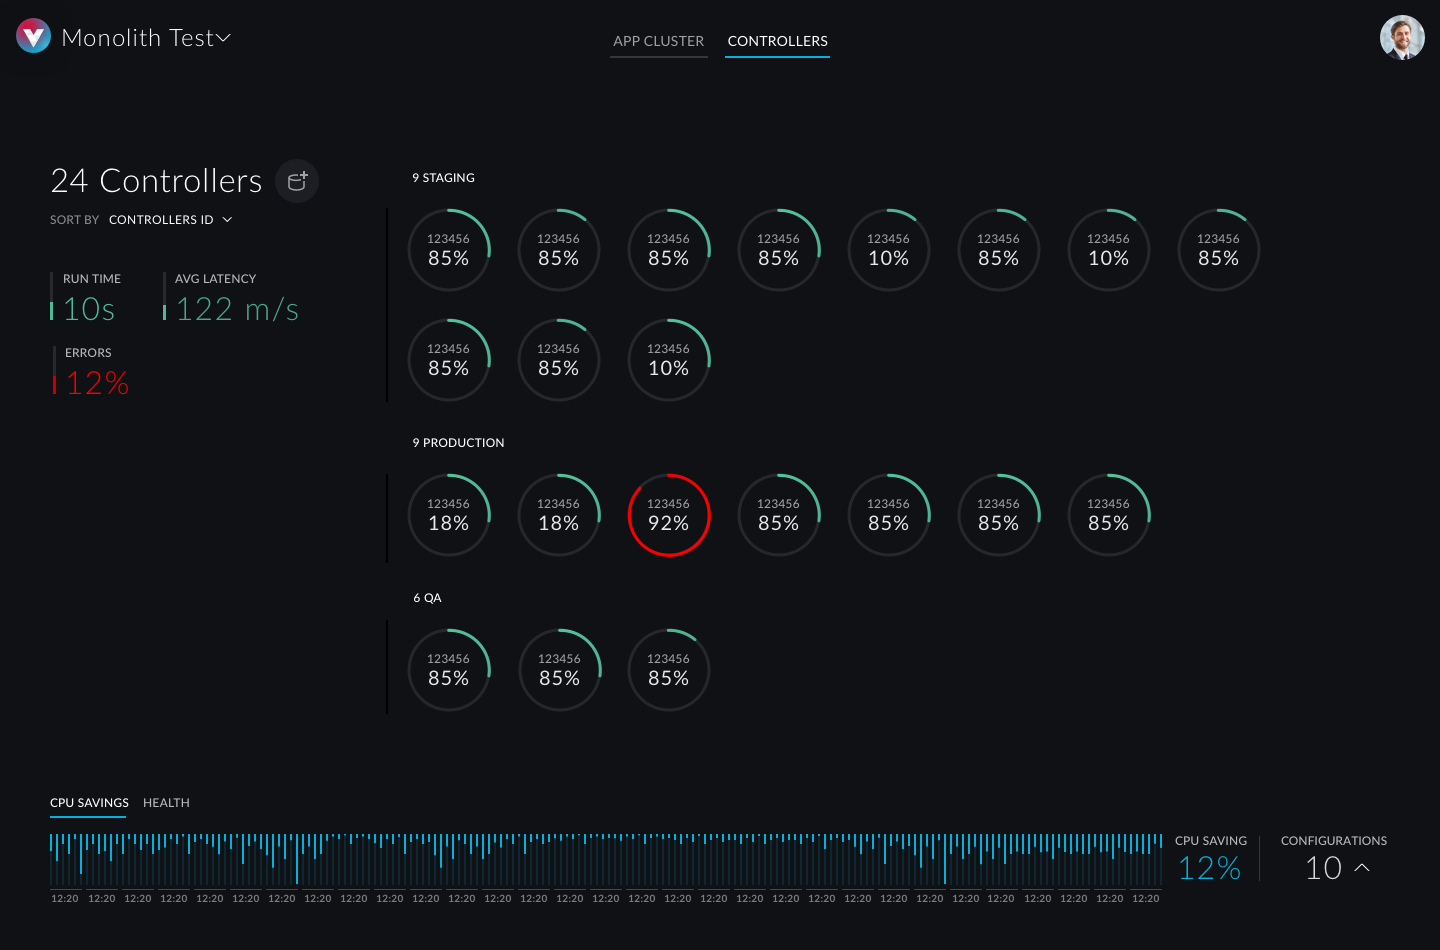
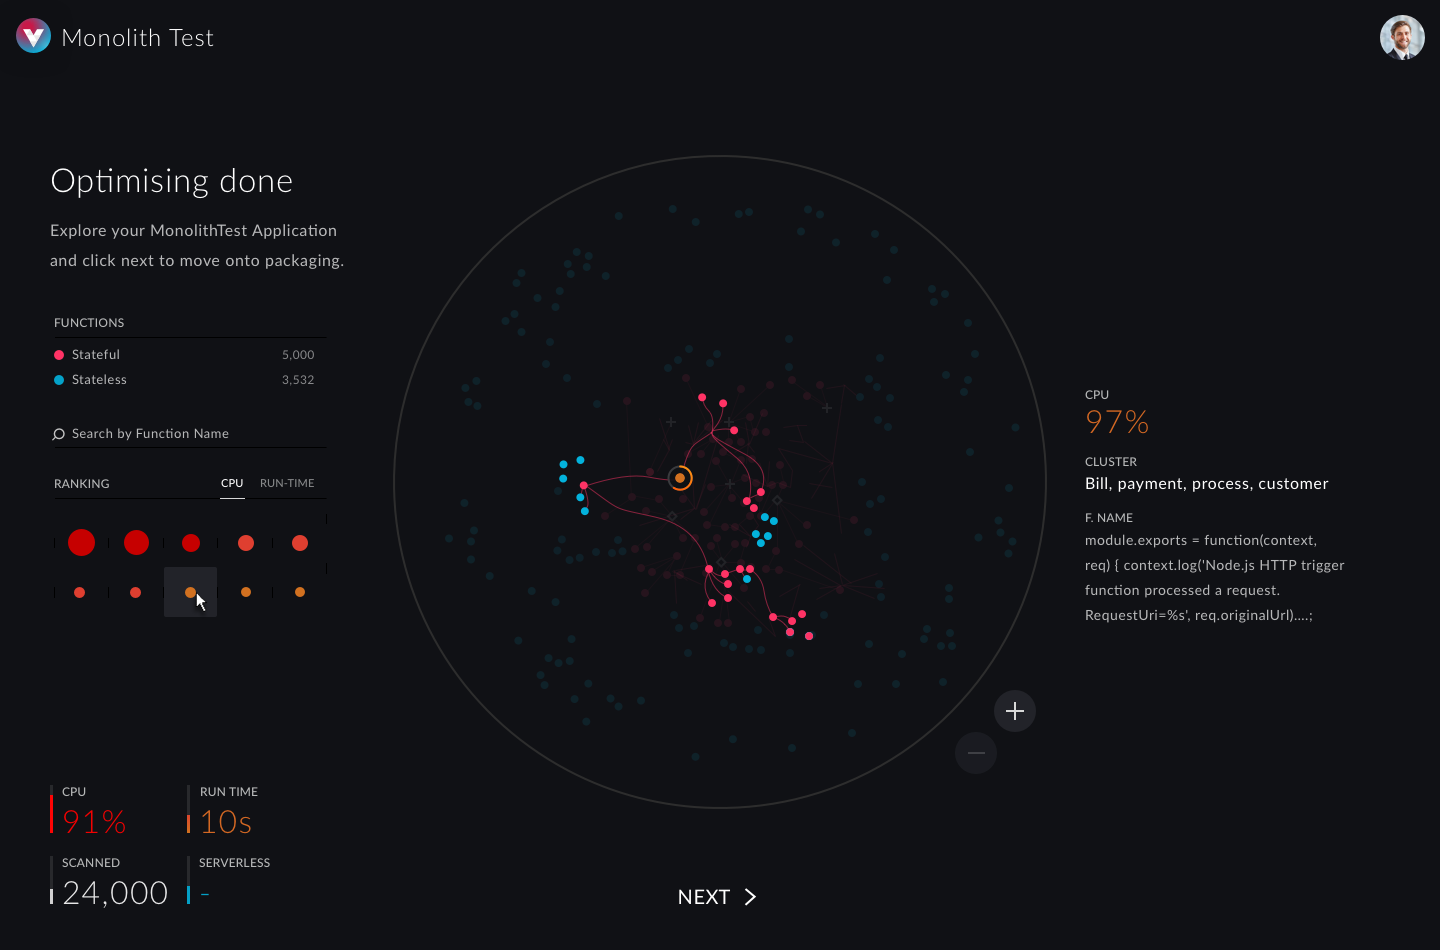
The product made an immediate impression with its animated onboarding experience and futuristic interface inspired by car cockpits. Sleek, tablet-optimised, and purpose-built for impact, it turned investor demos into engaging experiences rather than dry technical presentations.
This lean go-to-market approach paid off quickly. vFunction earned invitations to pitch at Microsoft, AWS, and other leading Series A investors—validation that our design strategy had successfully bridged the gap between complex technology and business narrative. The collaboration didn't end there; Fathom and vFunction continued iterating on both the technology stack and interface design for over three years, continuously refining based on user feedback and market evolution.
Six years later, the results speak for themselves. vFunction has earned numerous industry awards and seen widespread adoption across deep tech and AI sectors. The company exemplifies how focused design, agile development, and strategic partnerships can accelerate a startup's journey from concept to market leadership.
As the Lead Product Designer who launched vFunction's first go-to-market interface, I'm proud to have been part of this transformation from brilliant backend technology to industry-recognized platform.