Decoding Development Data: UX Design for Seerene
AboutSeerene is a Berlin-based startup, spun out of research at the Hasso Plattner Institute, that delivers developer analytics for enterprise software teams. Its platform consolidates data from multiple development systems and applies advanced pattern recognition to highlight code quality, team performance, and bottlenecks, giving engineering leaders the visibility they need to drive smarter decisions.
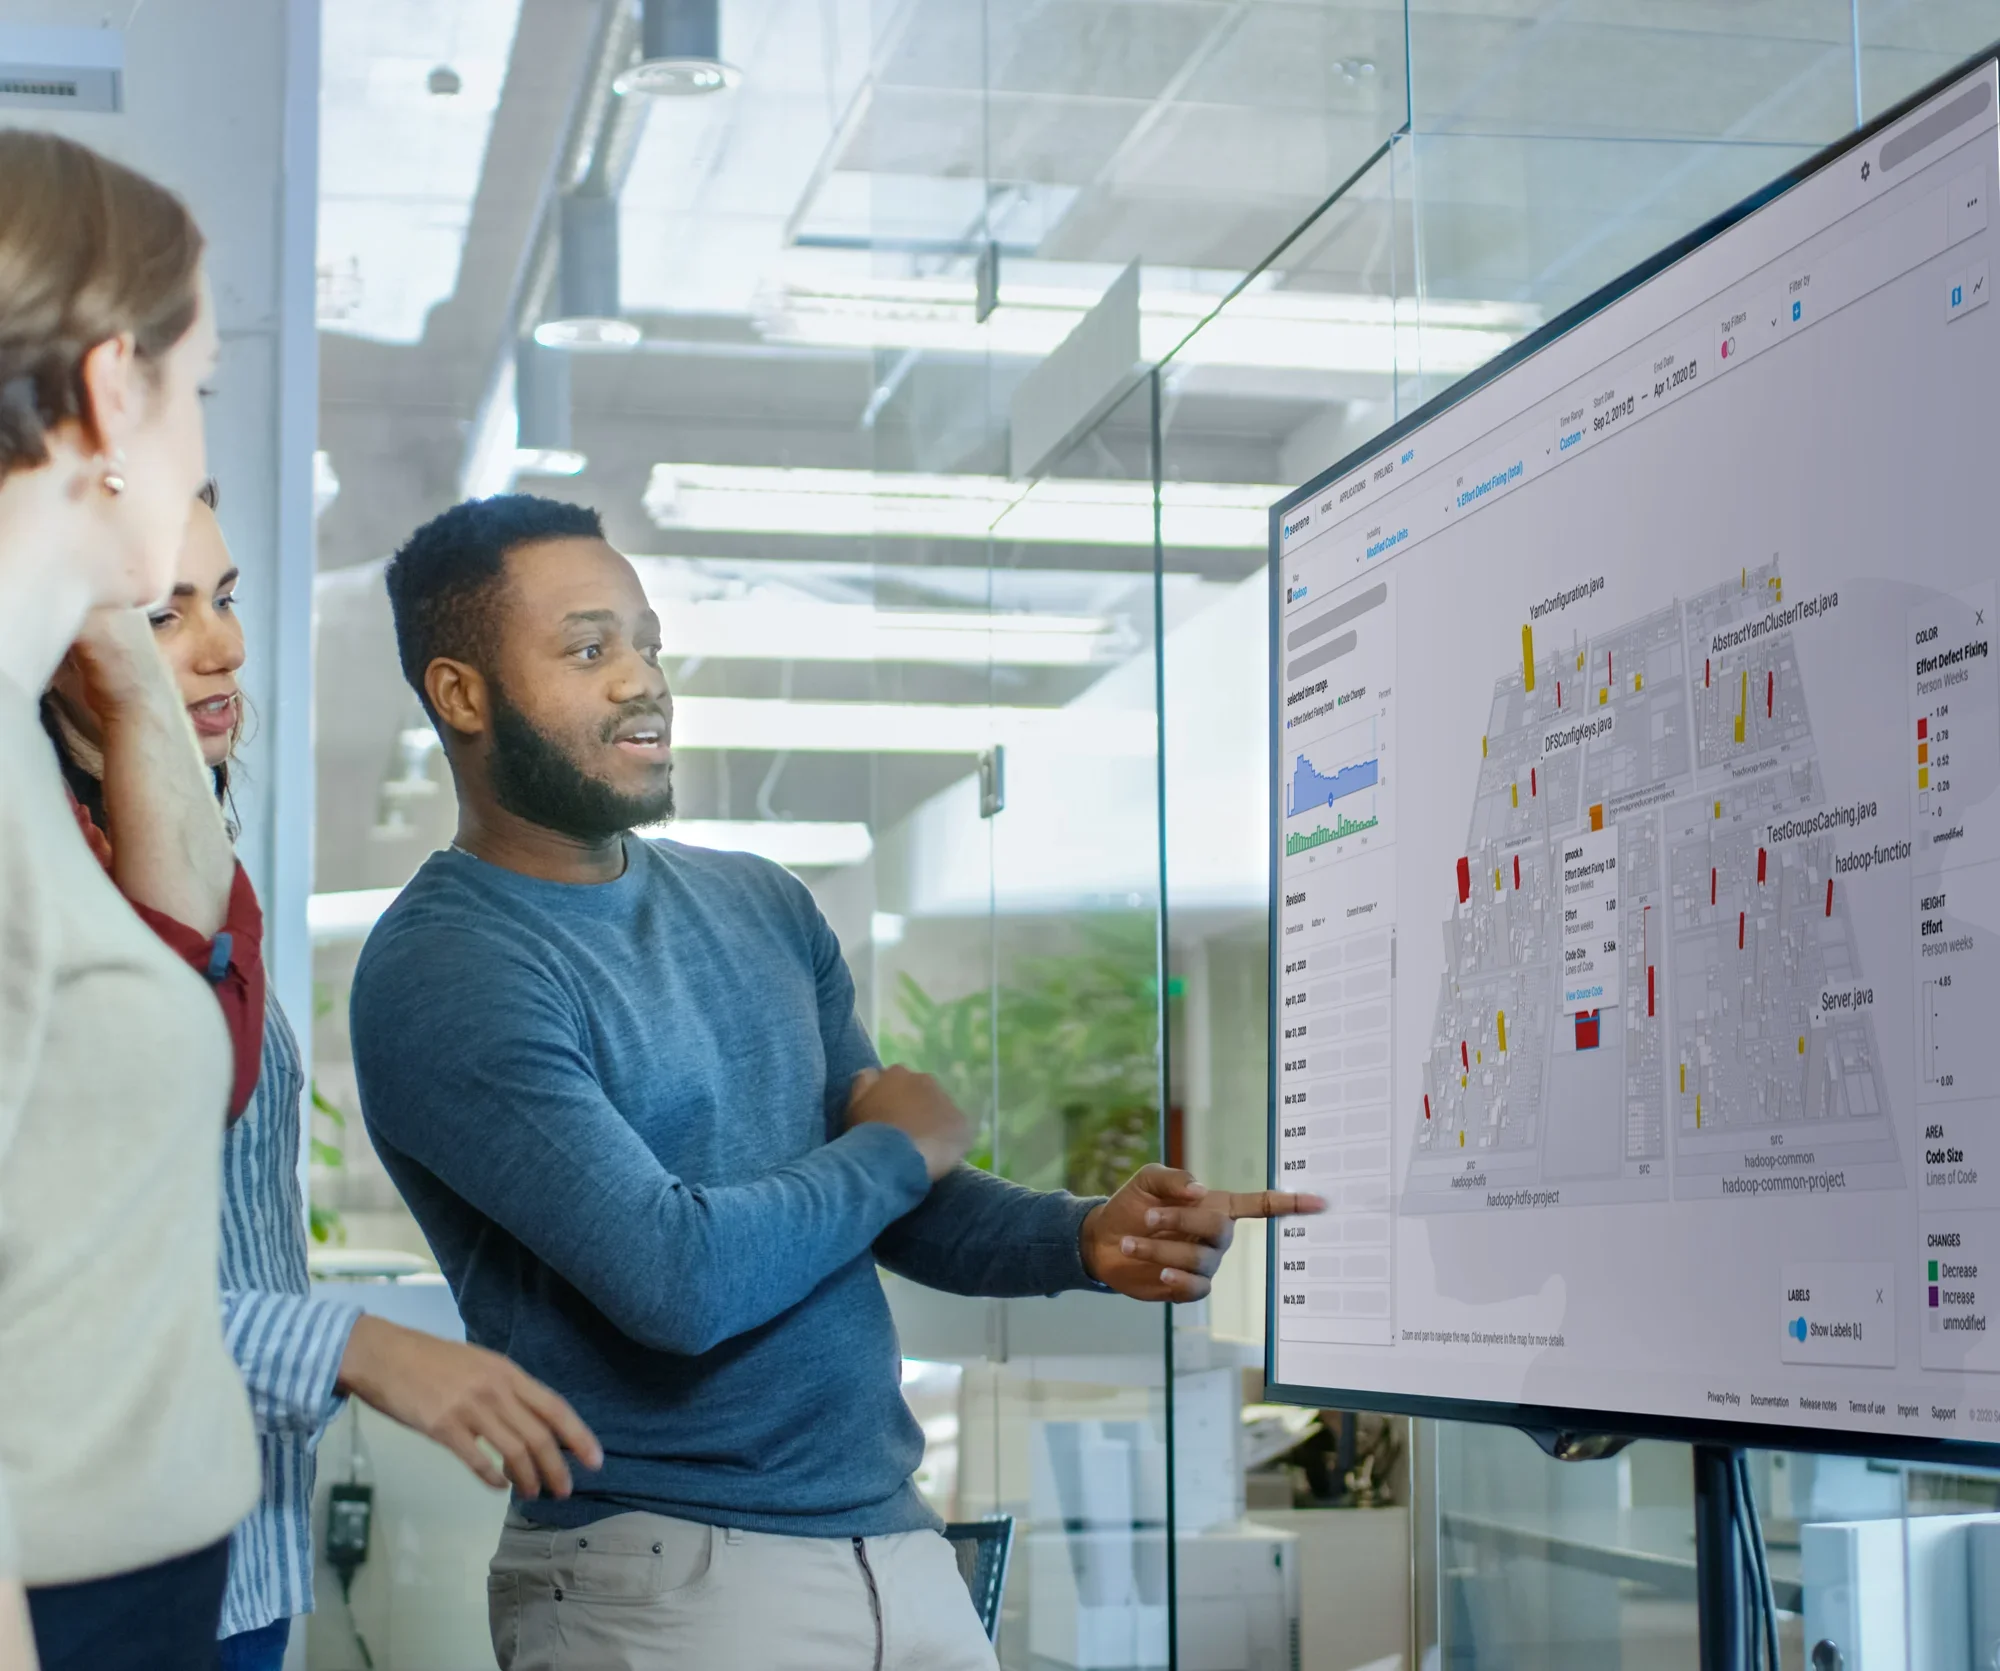
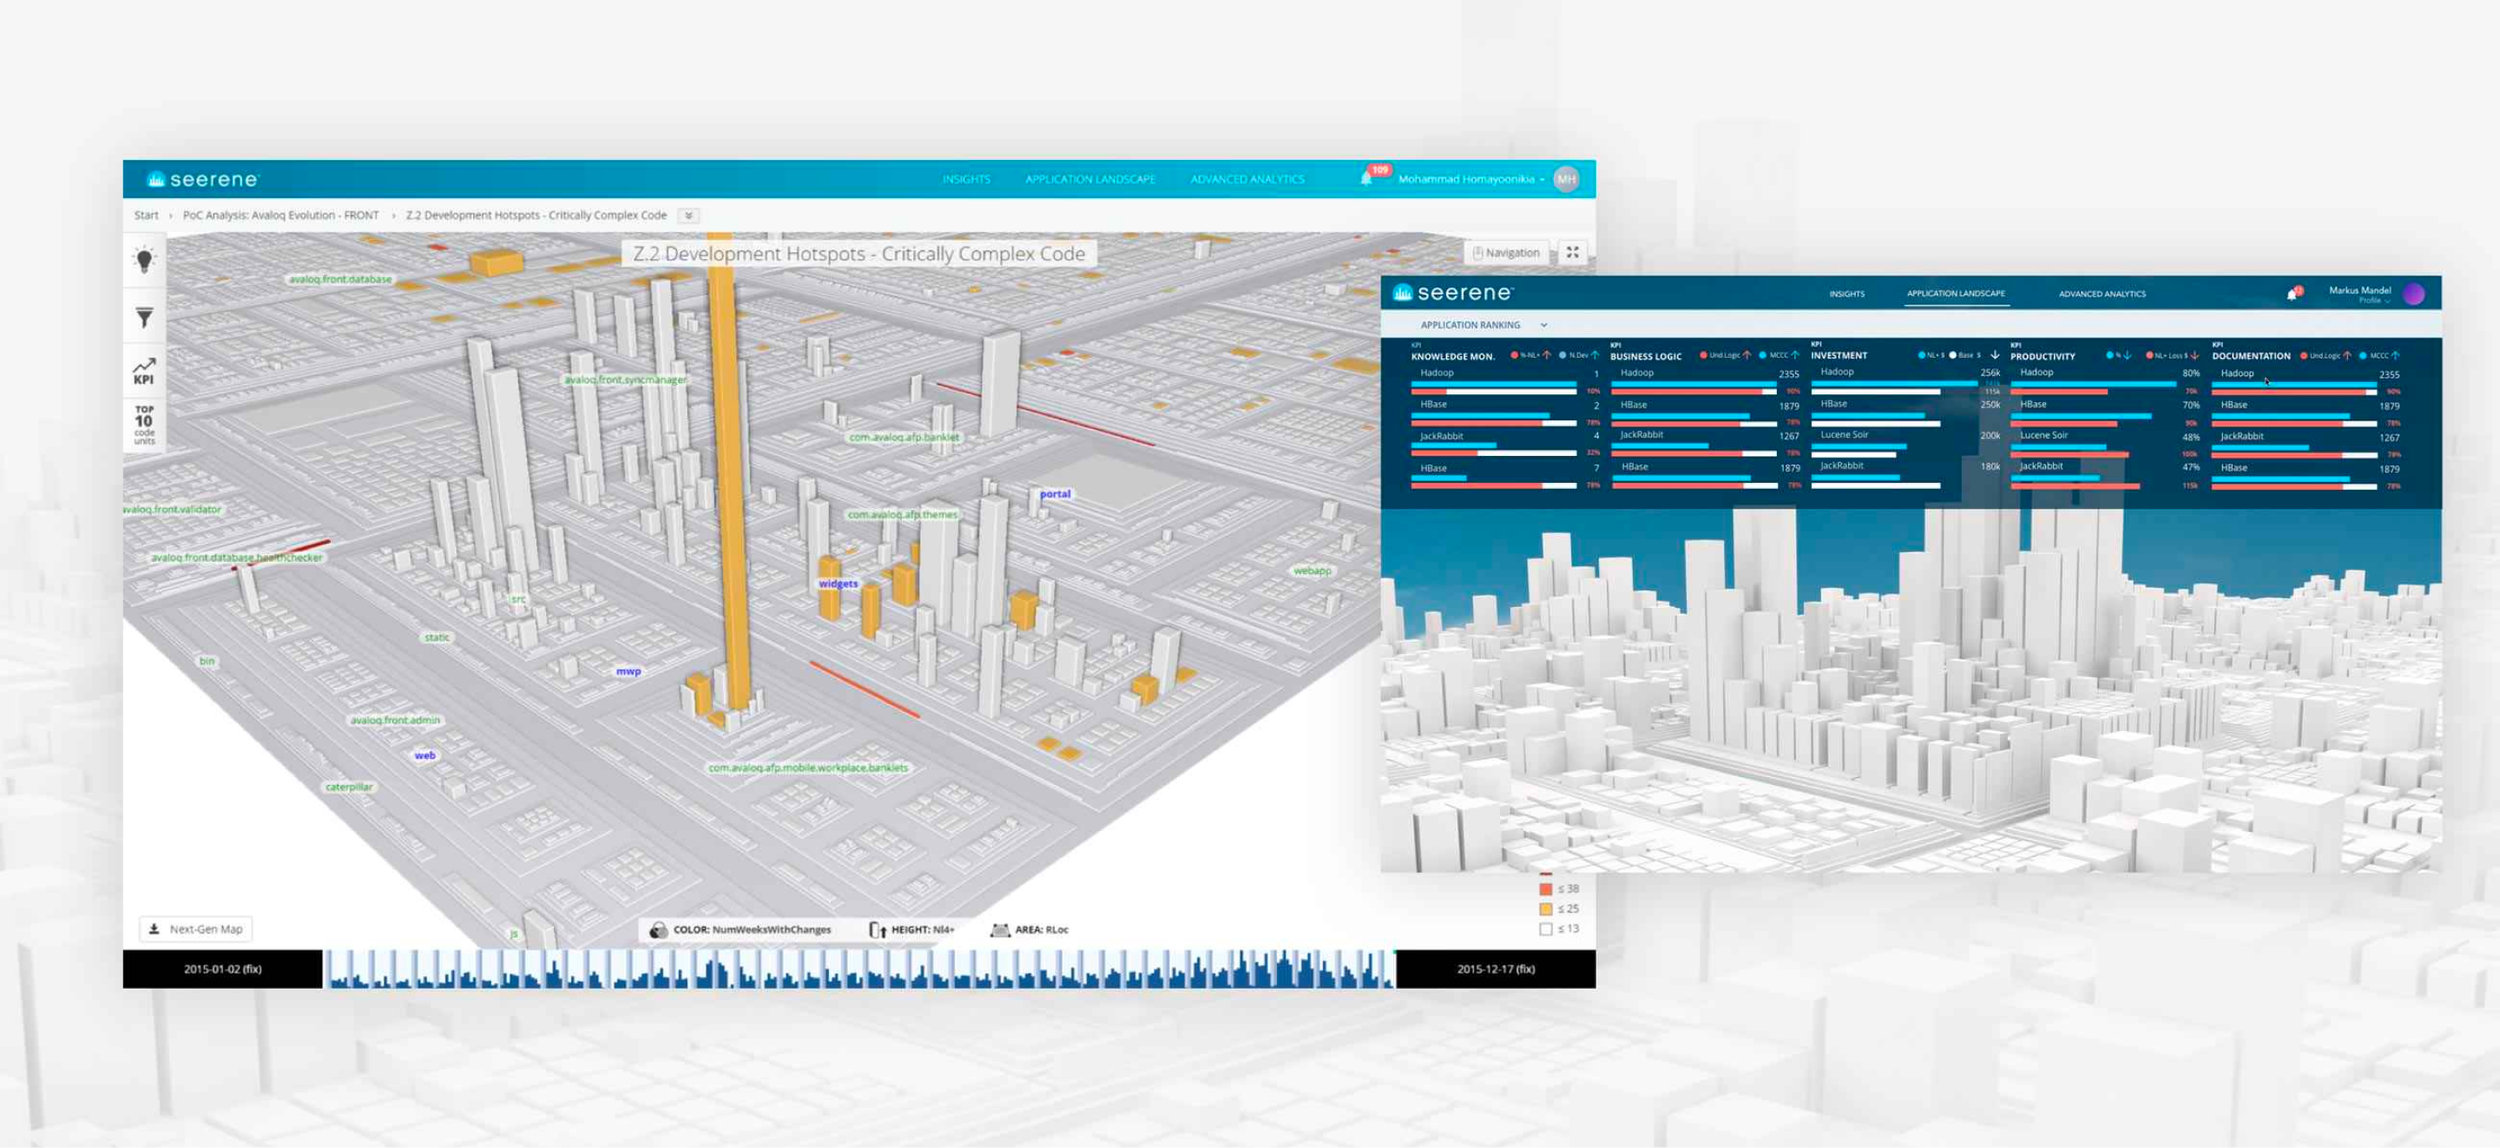
How it worksSeerene connects to a company’s development ecosystem, from code repositories to issue trackers, and aggregates the data into a unified analytics layer. Its algorithms analyze code structure, quality, and team activity, surfacing patterns and risks that would otherwise remain hidden. Insights are then visualized through interactive dashboards and 3D “software city maps,” giving engineering leaders a clear view of where bottlenecks exist, which teams need support, and how to optimize their development lifecycle.
Project Breakdown
ContextCompany: Seerene, Berlin-based startup, spin-off of the Hasso Plattner Institute, Potsdam University
Challenge: brilliant backend for developer analytics, interesting in-browser 3D data visualization, but an interface too complex for its intended users
Role: UX/UI Product Designer, in-house, working in Agile
Team: Product managers, 2 dev teams (Berlin + Poland), business and sales leads
Timeline: 5 months
My role and approachConducted user interviews with engineering managers and technical leads to map workflows
Audited taxonomy and interface language, translating academic/ML concepts into business language
Balanced quick wins (incremental usability improvements) with a long-term platform redesign
Facilitated weekly workshops with engineering and sales to align design decisions with client feedback
Defined a design system and front-end migration path: custom UI → React + Material Design
Key UX SolutionsOnboarding Journeys: restructured navigation and flows to match how managers make optimisation decisions
Taxonomy & Language: reframed academic terms into accessible business/engineering language
Quick Wins: redesigned filtering, naming, and core interactions through bi-weekly iterations
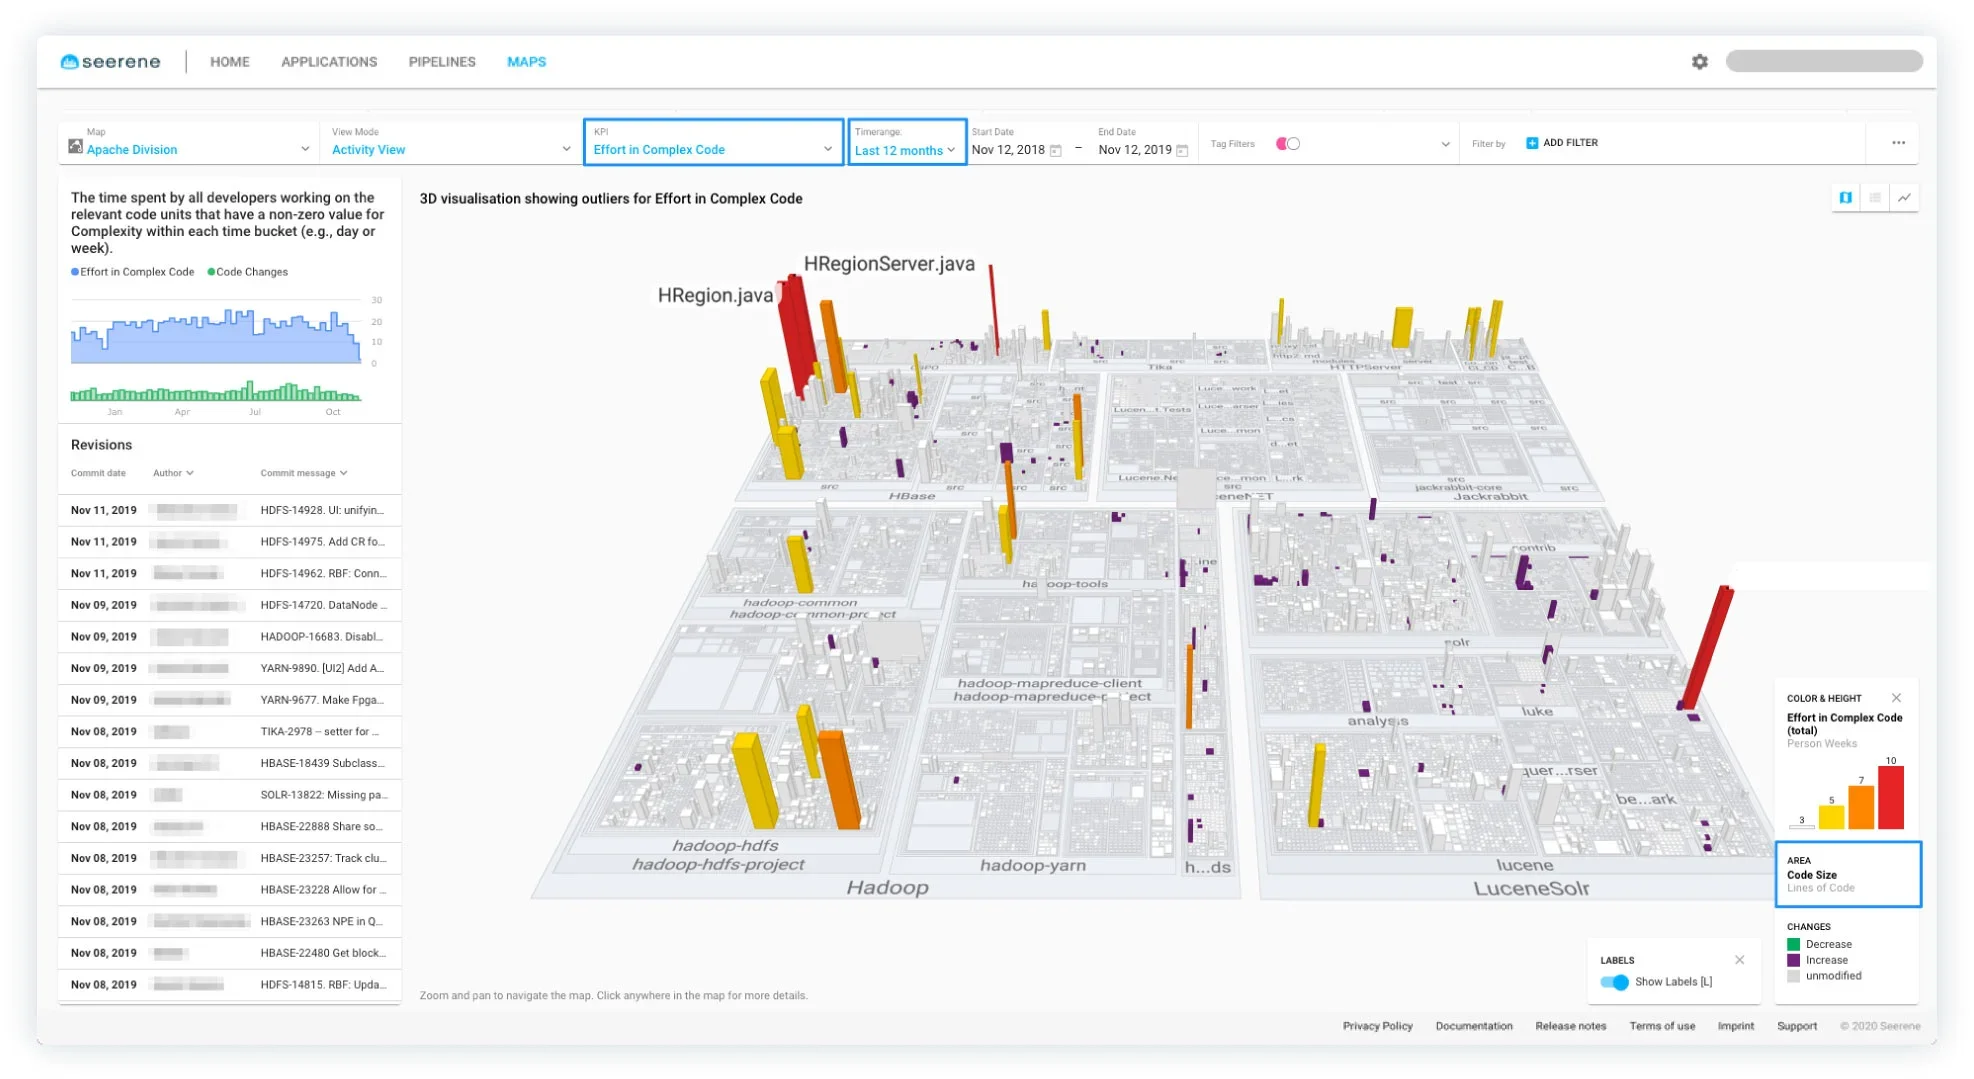
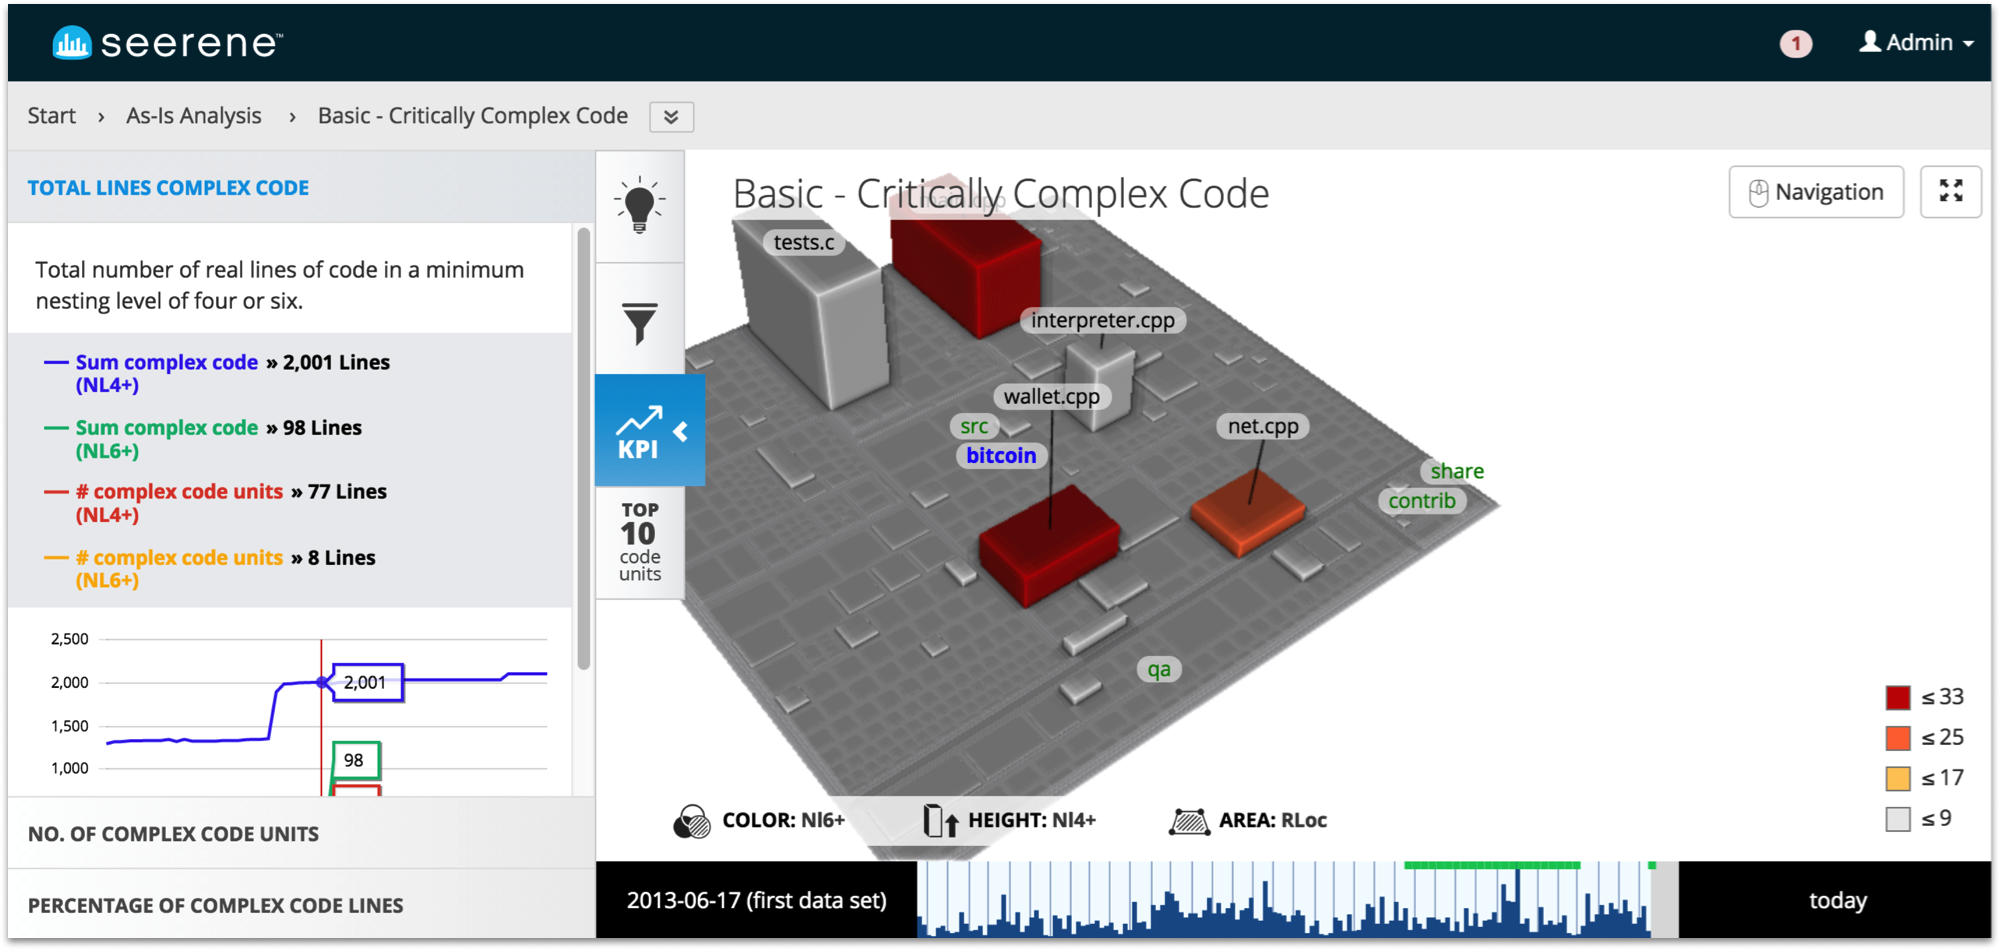
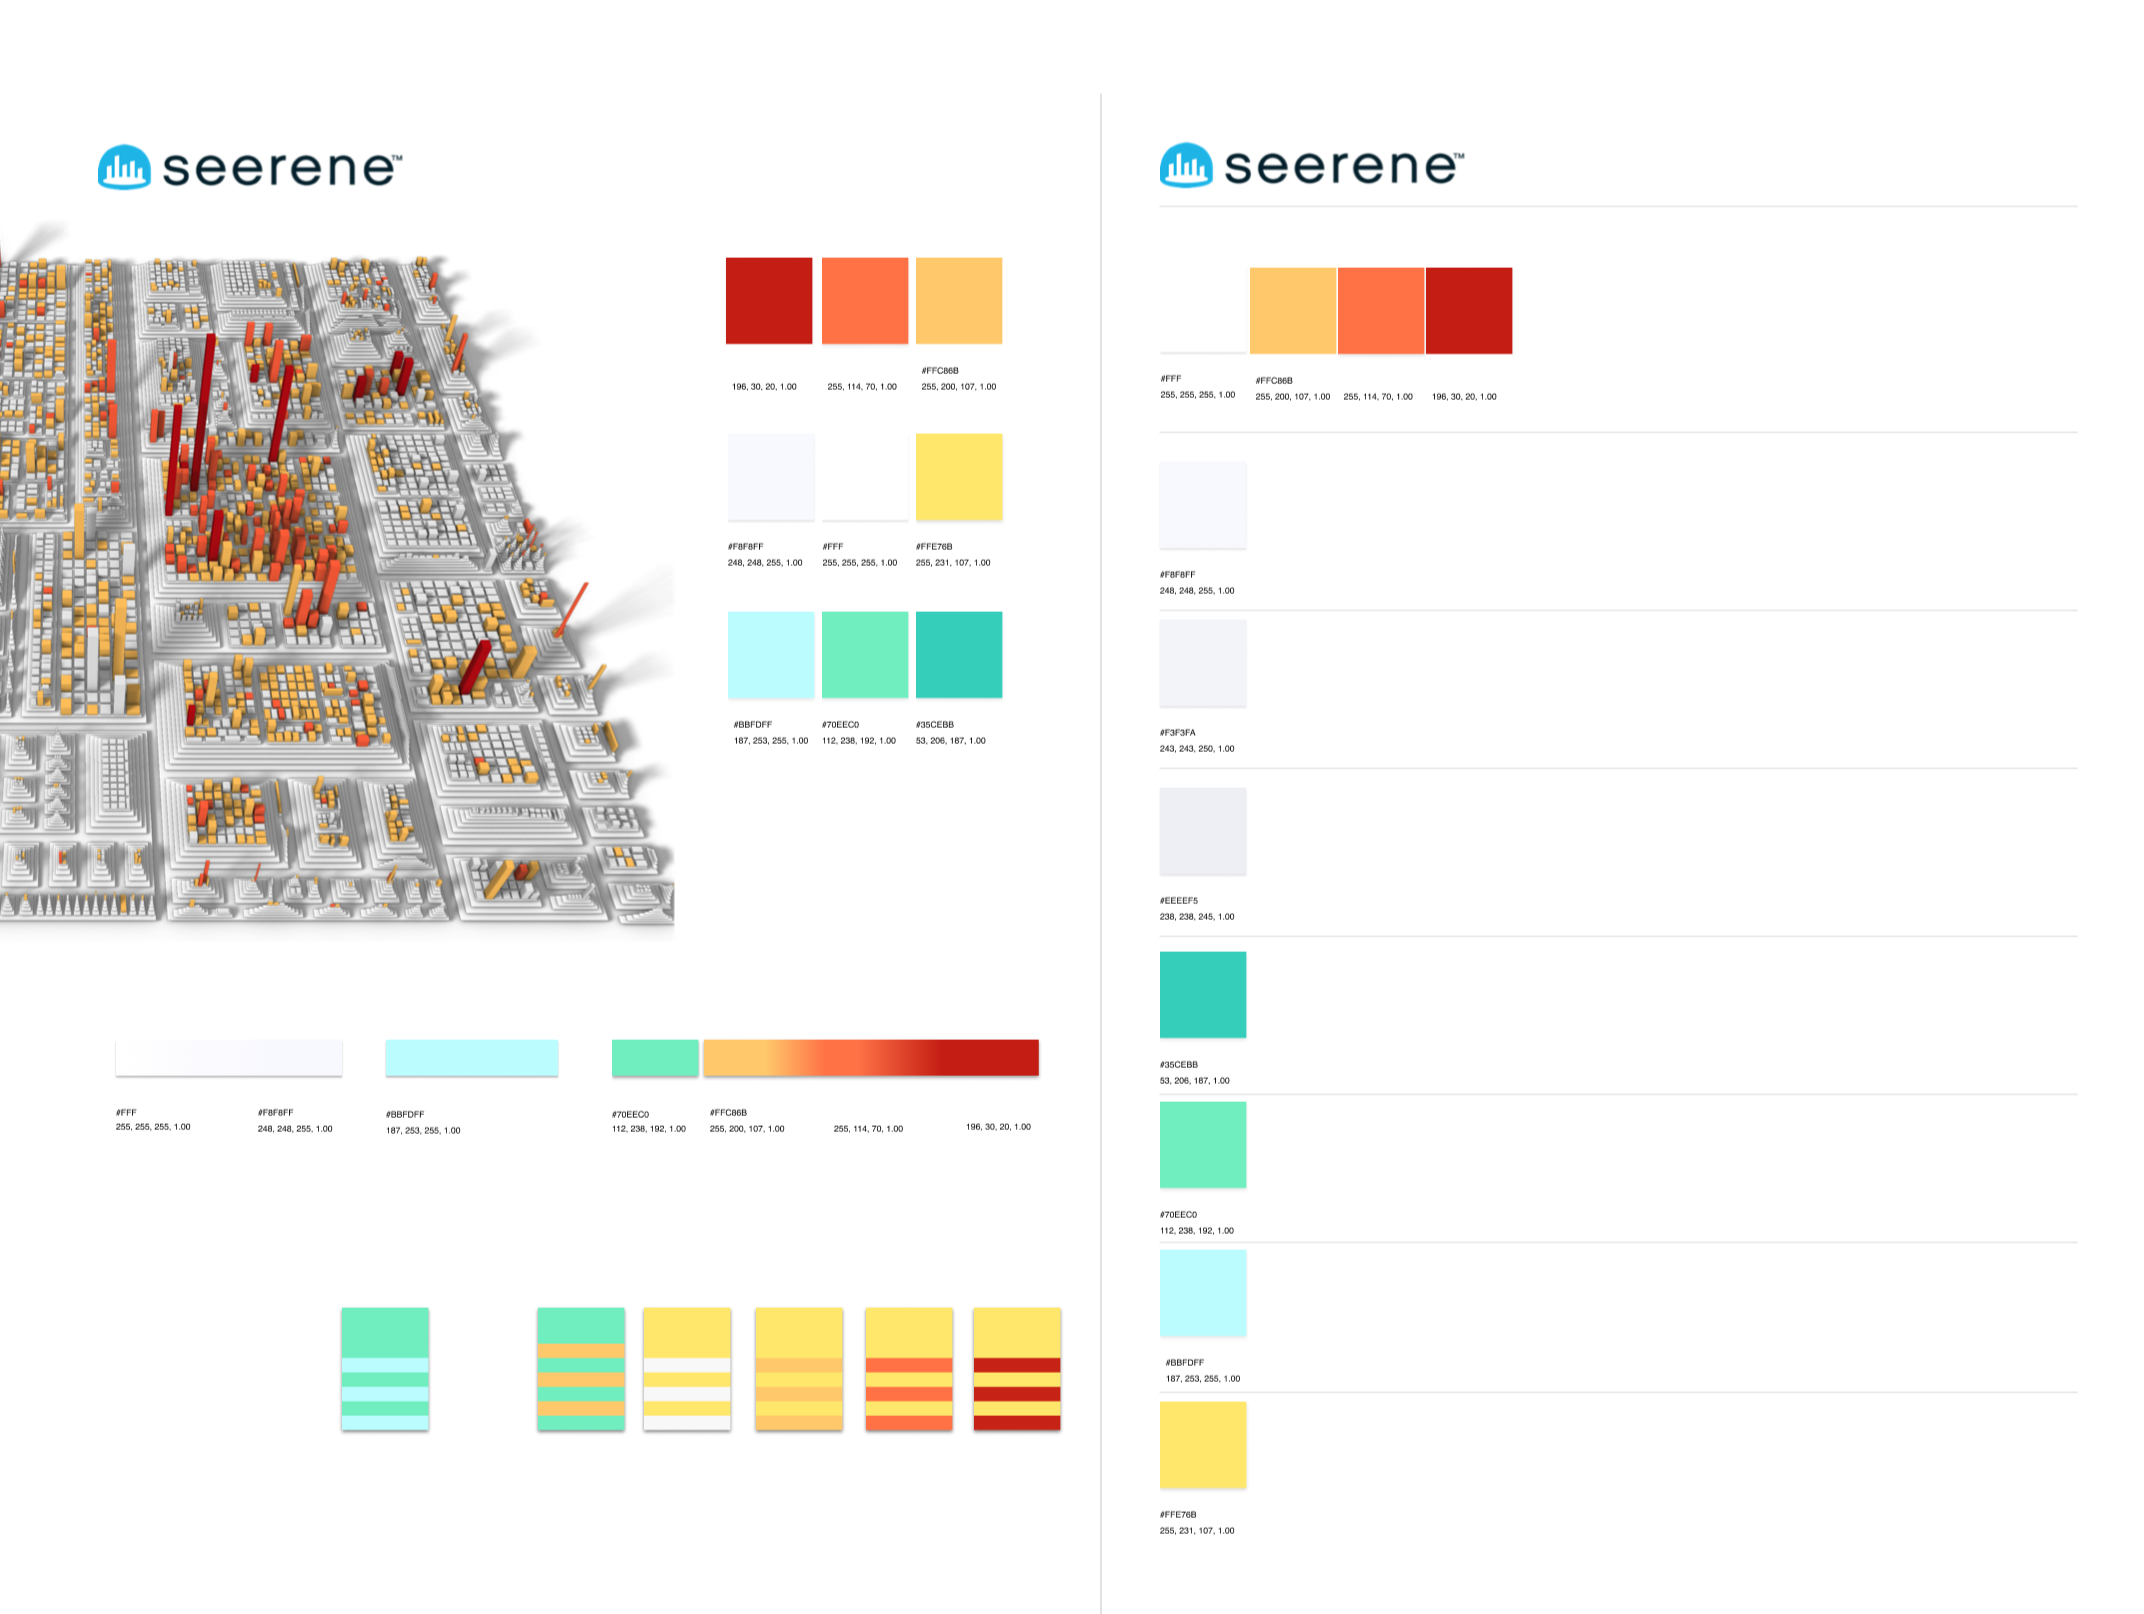
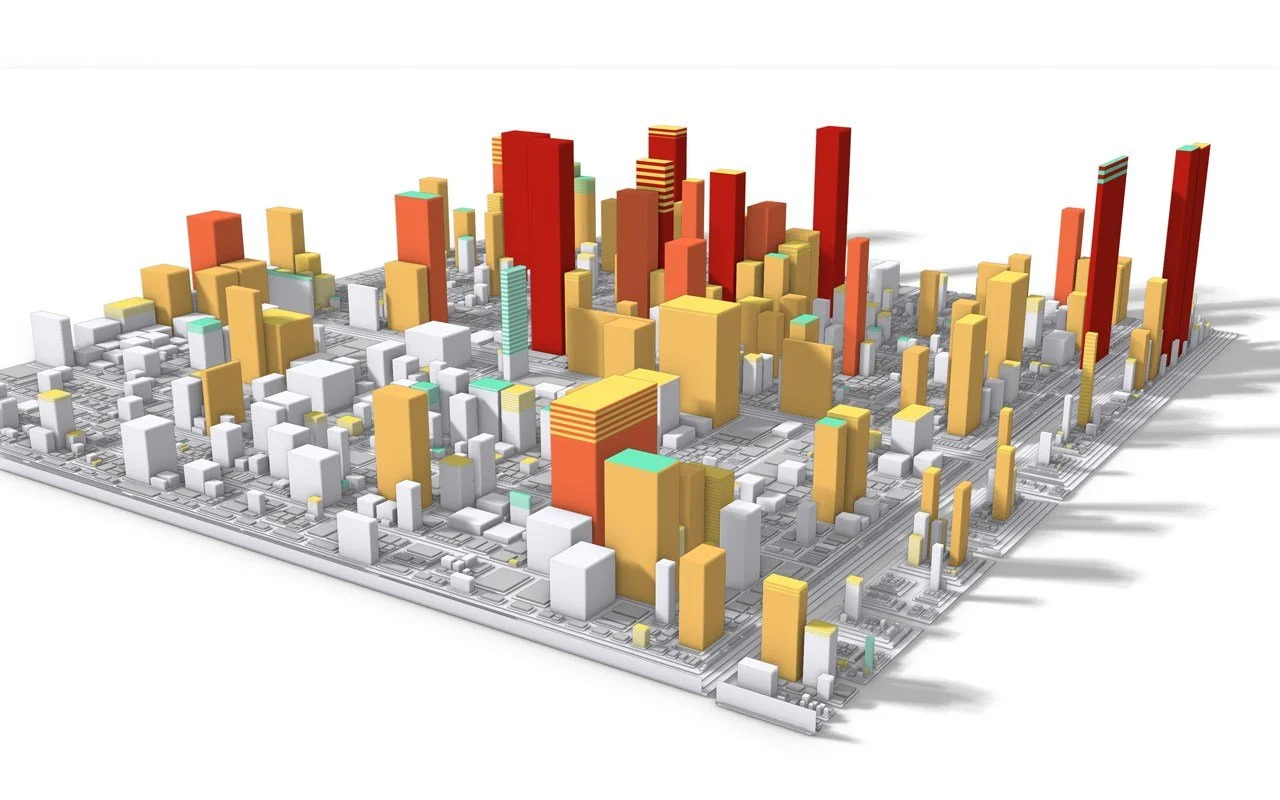
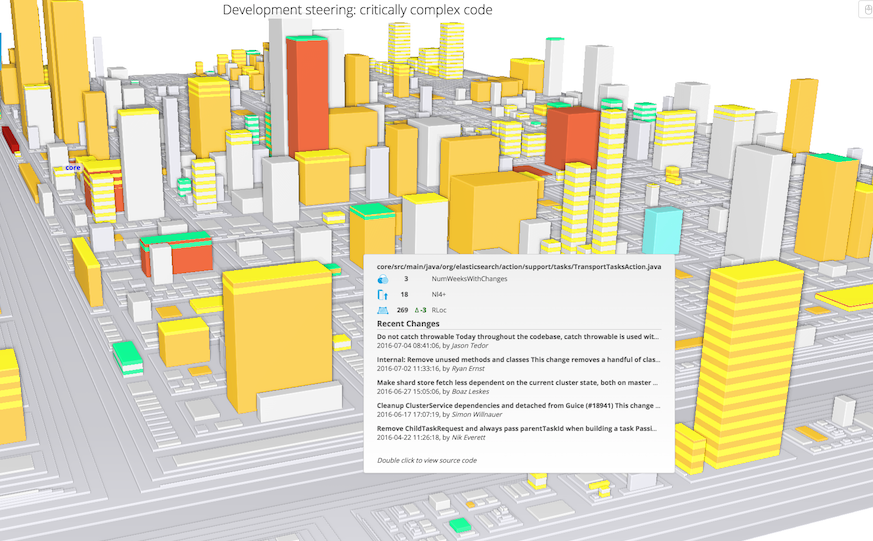
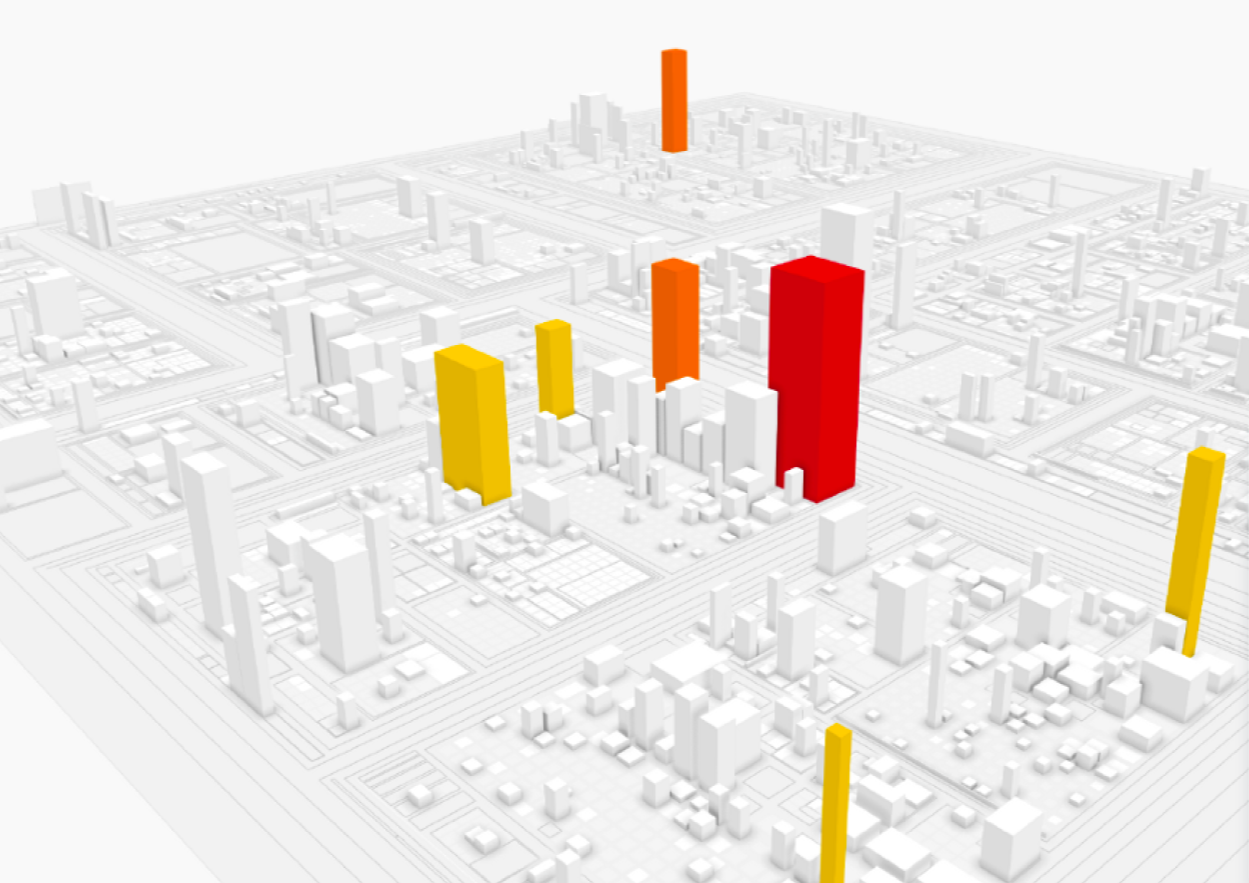
Data Visualization: introduced a high-contrast color system for 3D “software city maps” to make quality issues instantly clear
Design System: delivered a scalable UI style guide and component library to support React migration
Continuous Feedback: built in validation loops with clients, driving adoption and trust
ImpactTransformed platform from intimidating prototype into an approachable enterprise product
Enabled engineering managers to quickly identify bottlenecks, quality issues, and opportunities
Improved performance and reduced cognitive load through design + engineering collaboration
Redesign won strong reception from both enterprise clients and investors, accelerating adoption
From Complex to Clear: Redesigning Seerene's Developer Analytics Platform
Seerene is a Berlin-based startup that's tackling one of software development's most persistent challenges: the visibility gap between what's happening in your codebase and what teams actually need to improve. Using advanced data analytics and intelligent pattern recognition, Seerene helps engineering teams identify specific bottlenecks, quality issues, and optimisation opportunities across their entire development lifecycle.
Their technology stack leverages data from multiple development systems, identifies patterns in code quality and team performance, and surfaces actionable insights that inform strategic decisions, all while maintaining the technical depth that experienced engineers demand. When I joined the project, the founders had built powerful analytical capabilities. Still, they faced a common deep tech dilemma: brilliant backend technology with an interface that reflected system complexity rather than user workflow.
My challenge: redesign and optimize their development analytics platform over 5 months. This redesign needed to transform complex data relationships into intuitive user journeys, restructure navigation to match how teams actually approach optimization decisions, and create an experience that would make engineering leaders want to dig deeper rather than click away.
Discovery Sprint: Understanding the Engineer's Dilemma
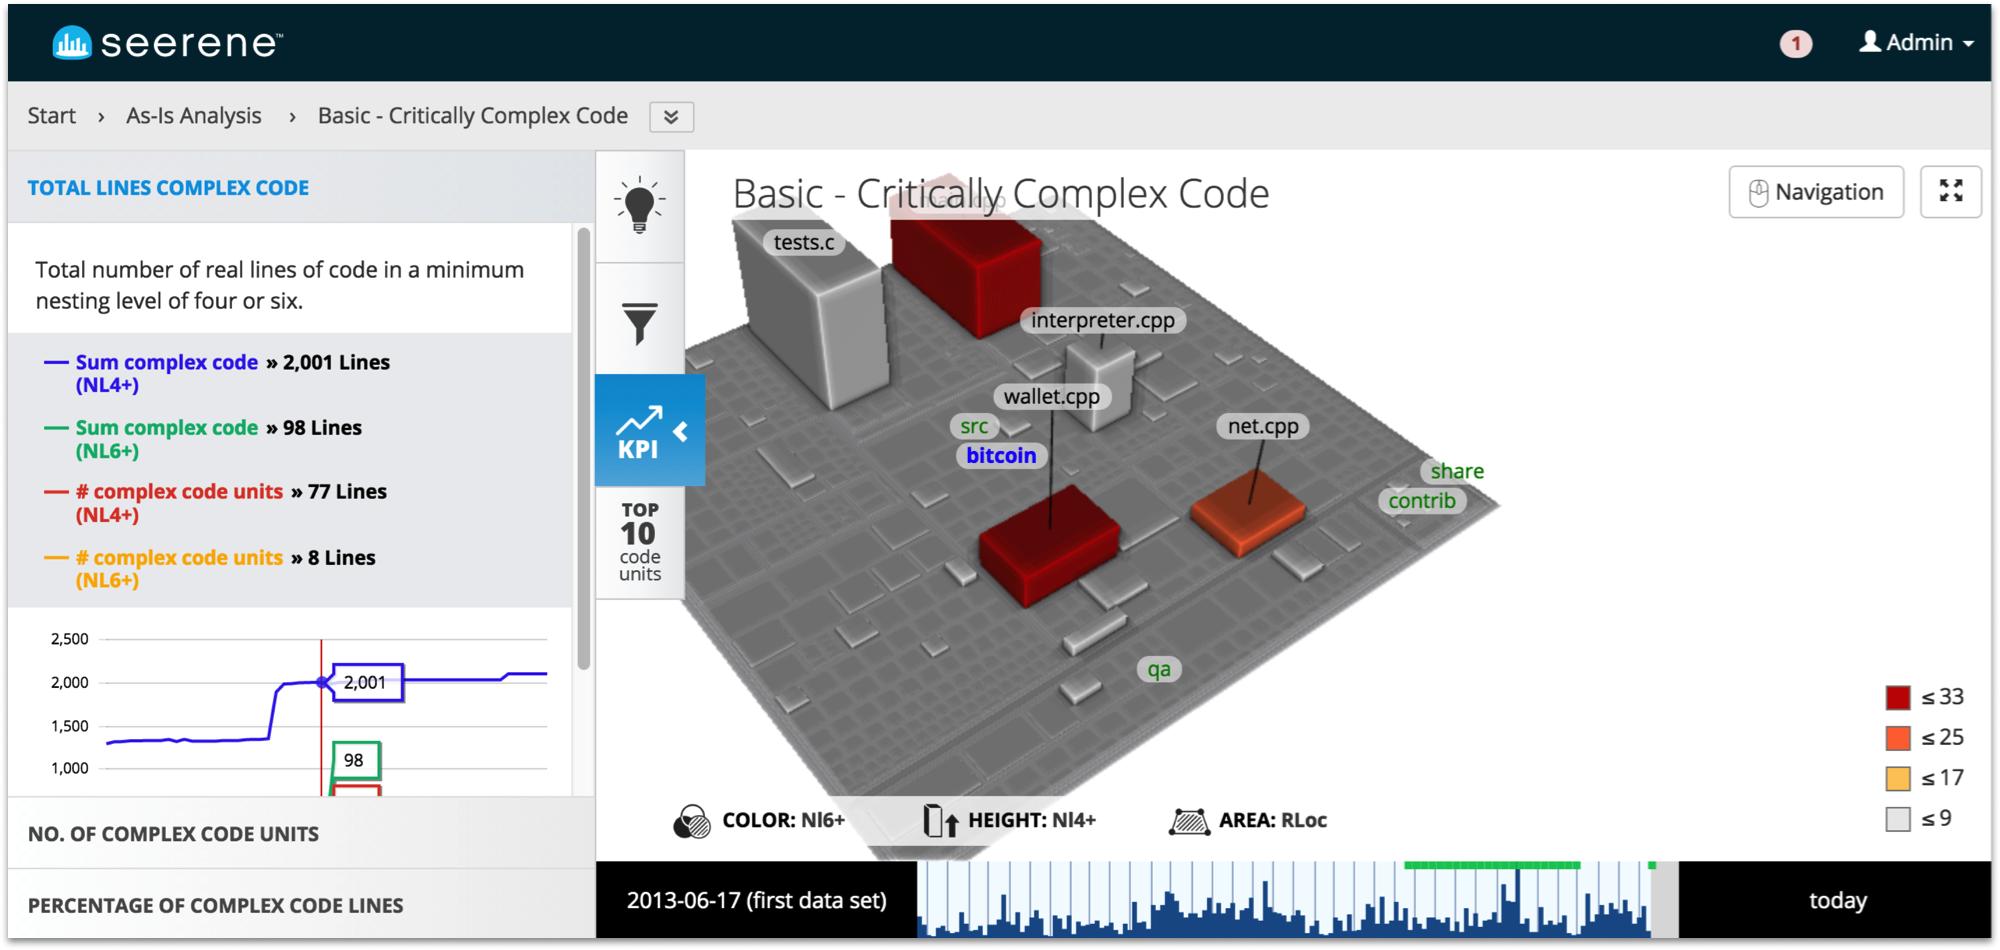
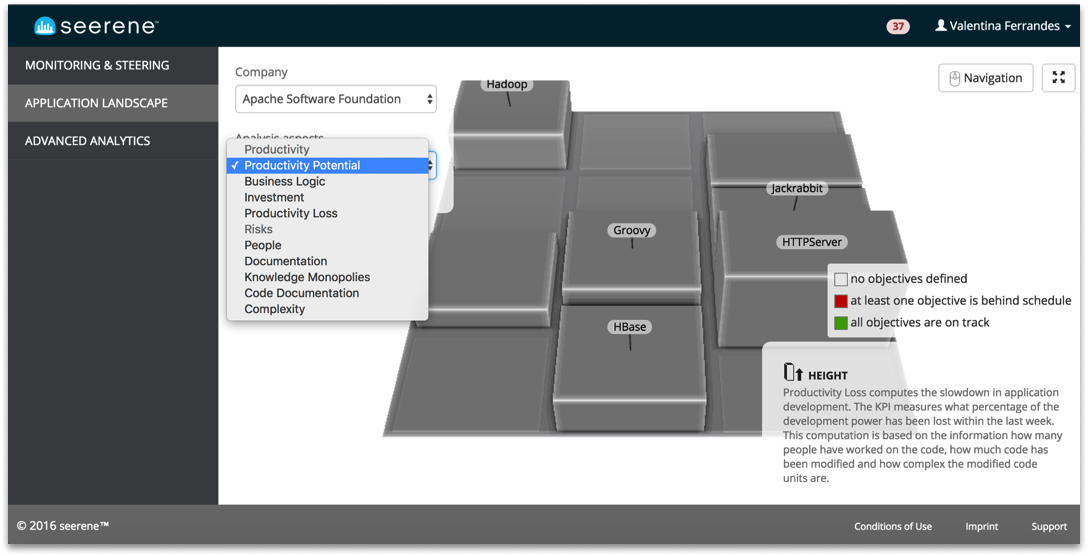
Seerene’s journey began as a PhD project at the Hasso Plattner Institute before evolving into a venture-funded startup. At its core was a sophisticated algorithm that crawled codebases, analyzed their grammar and architecture, and produced quality assessments as color-coded “software city maps.” The technology was groundbreaking, offering insights that would take engineering teams months to uncover manually. Yet the paradox was clear: a tool designed to simplify complexity had itself become too complex. The taxonomy reflected academic concepts rather than management workflows, navigation assumed deep technical knowledge, and the interface intimidated its intended users. As sole UX designer, my role was to preserve Seerene’s analytical sophistication while translating these insights into intuitive user journeys. This meant improving the existing UI, restructuring the most critical flows, and working directly with business, sales, and technical directors across two development teams as part of the Agile process.
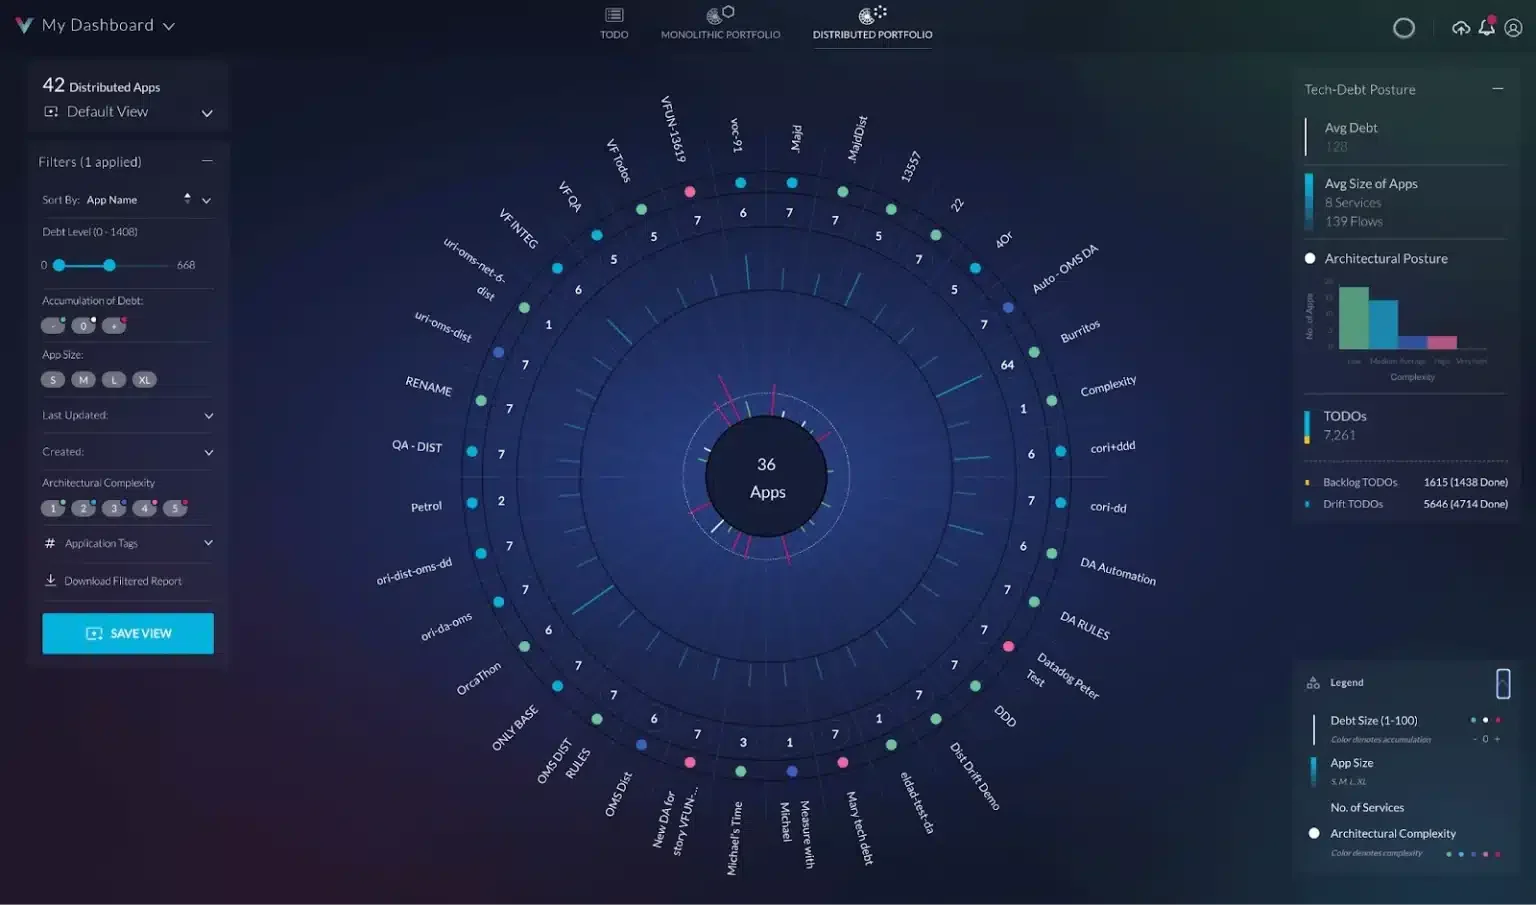
Here's what the platform looked like on Day 1.
Solving the Complexity Puzzle: A Systematic Design Approach
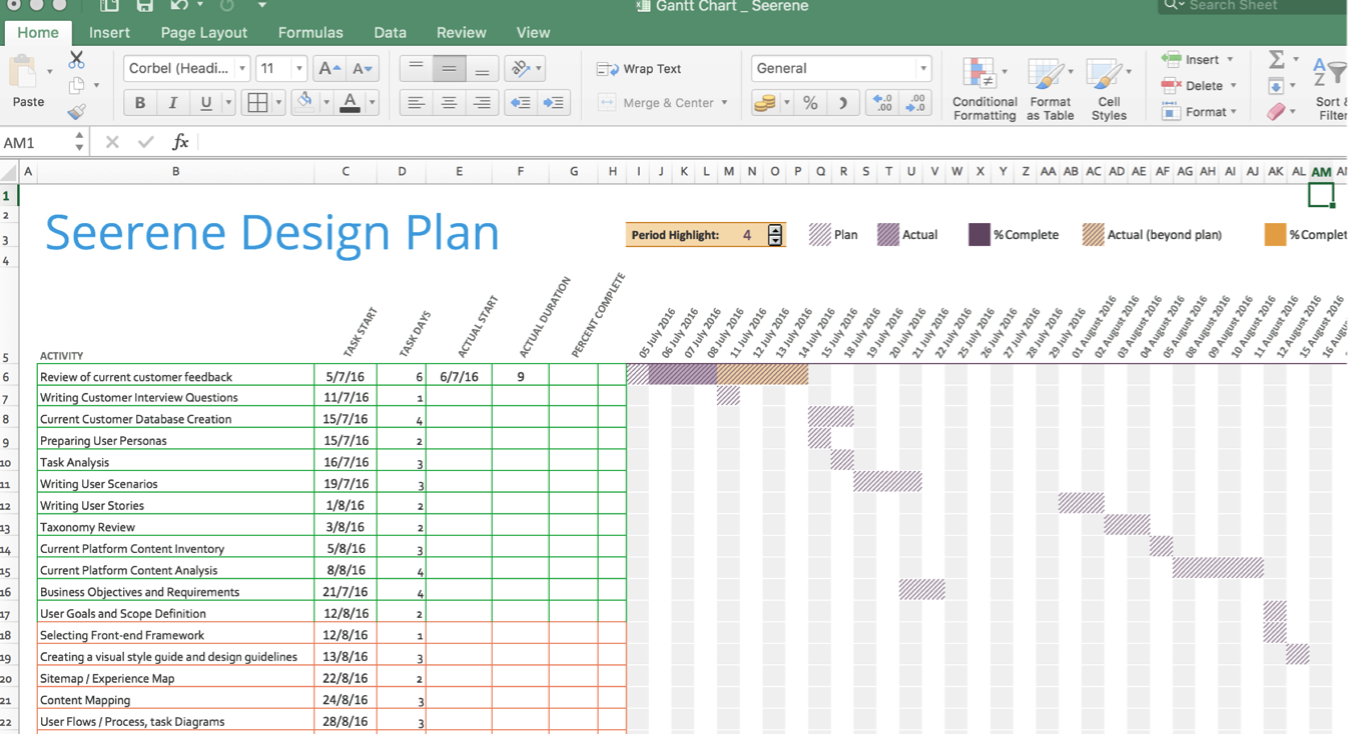
We kicked off a comprehensive product design process to untangle this complexity challenge:
Research & Discovery: Conducted user interviews with engineering managers and technical leaders to understand how they currently evaluate software quality and make optimization decisions.
Case Study Development: Documented specific user scenarios where the platform's insights could drive meaningful improvements, creating concrete examples of value delivery.
Opportunity Mapping: Identified key areas where product development could bridge the gap between analytical power and user accessibility.
Taxonomy & Language Audit: Reviewed existing terminology and information architecture, translating machine learning concepts into engineering management buusiness language.
Agile Integration: Collaborated with product managers to negotiate design priorities, plan iterative improvements, and execute changes through structured sprints.
Performance Optimization: Worked directly with engineering teams to improve platform responsiveness and reduce cognitive load through incremental technical enhancements.
Feedback Loops: Established continuous user feedback cycles to validate design decisions and guide iterative improvements.
Visual Design System: Developed a comprehensive UI refresh with new style guidelines that made complex data feel more approachable and actionable.
This systematic approach ensured we addressed both surface-level usability issues and deeper structural problems that were limiting platform adoption.
Strategic Redesign: from custom UI to React and Material Design
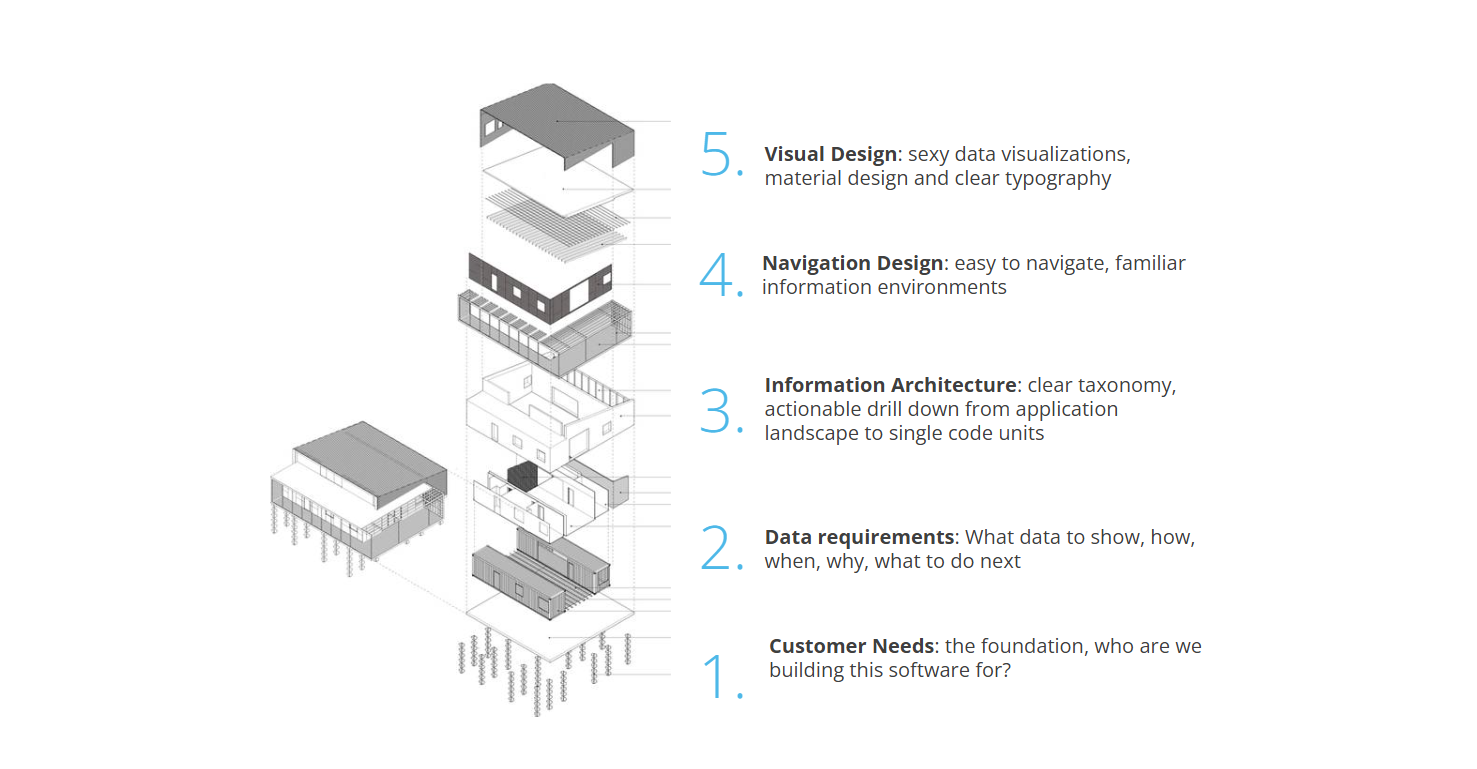
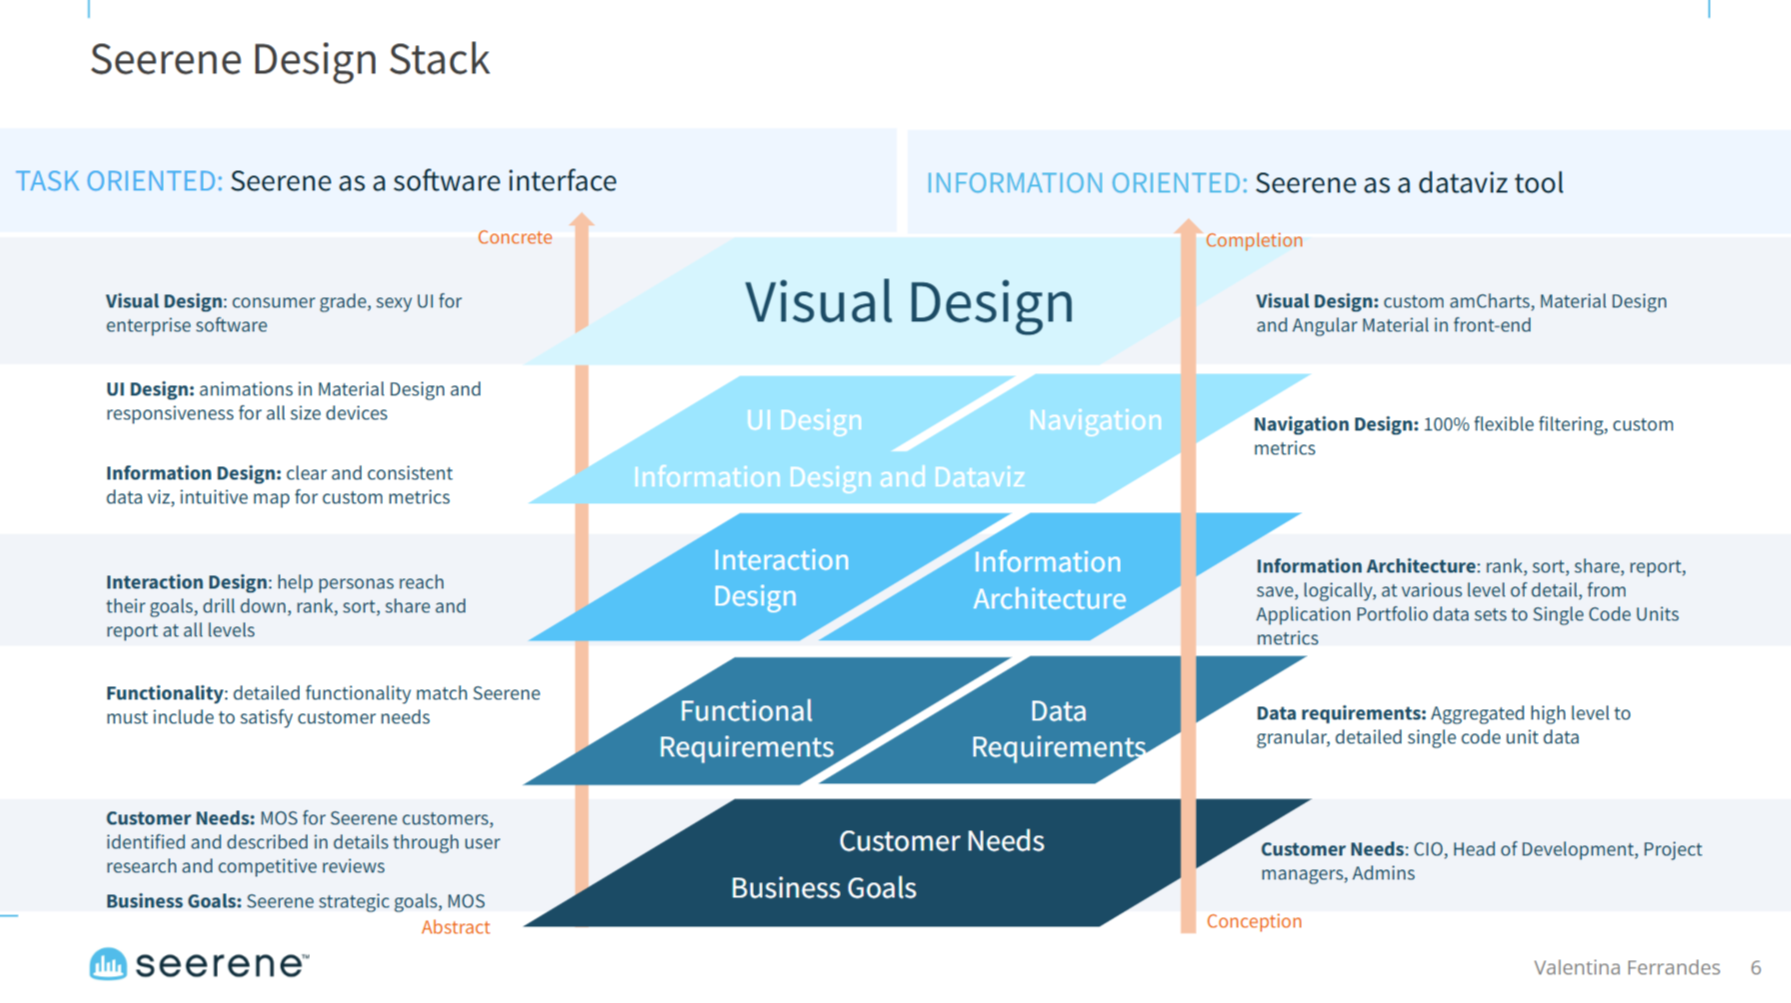
Based on our brainstorming sessions, we planned a platform redesign and a complete front-end framework update. We needed to transition from a custom UI front-end to a Material Design Component Library built on a React responsive framework.
I set the redesign goals and worked with PMs and Engineering teams to split the work into manageable packages, balancing immediate usability improvements with longer-term architectural changes.
This systematic approach allowed us to maintain platform functionality while implementing substantial structural improvements across iterative development cycles.
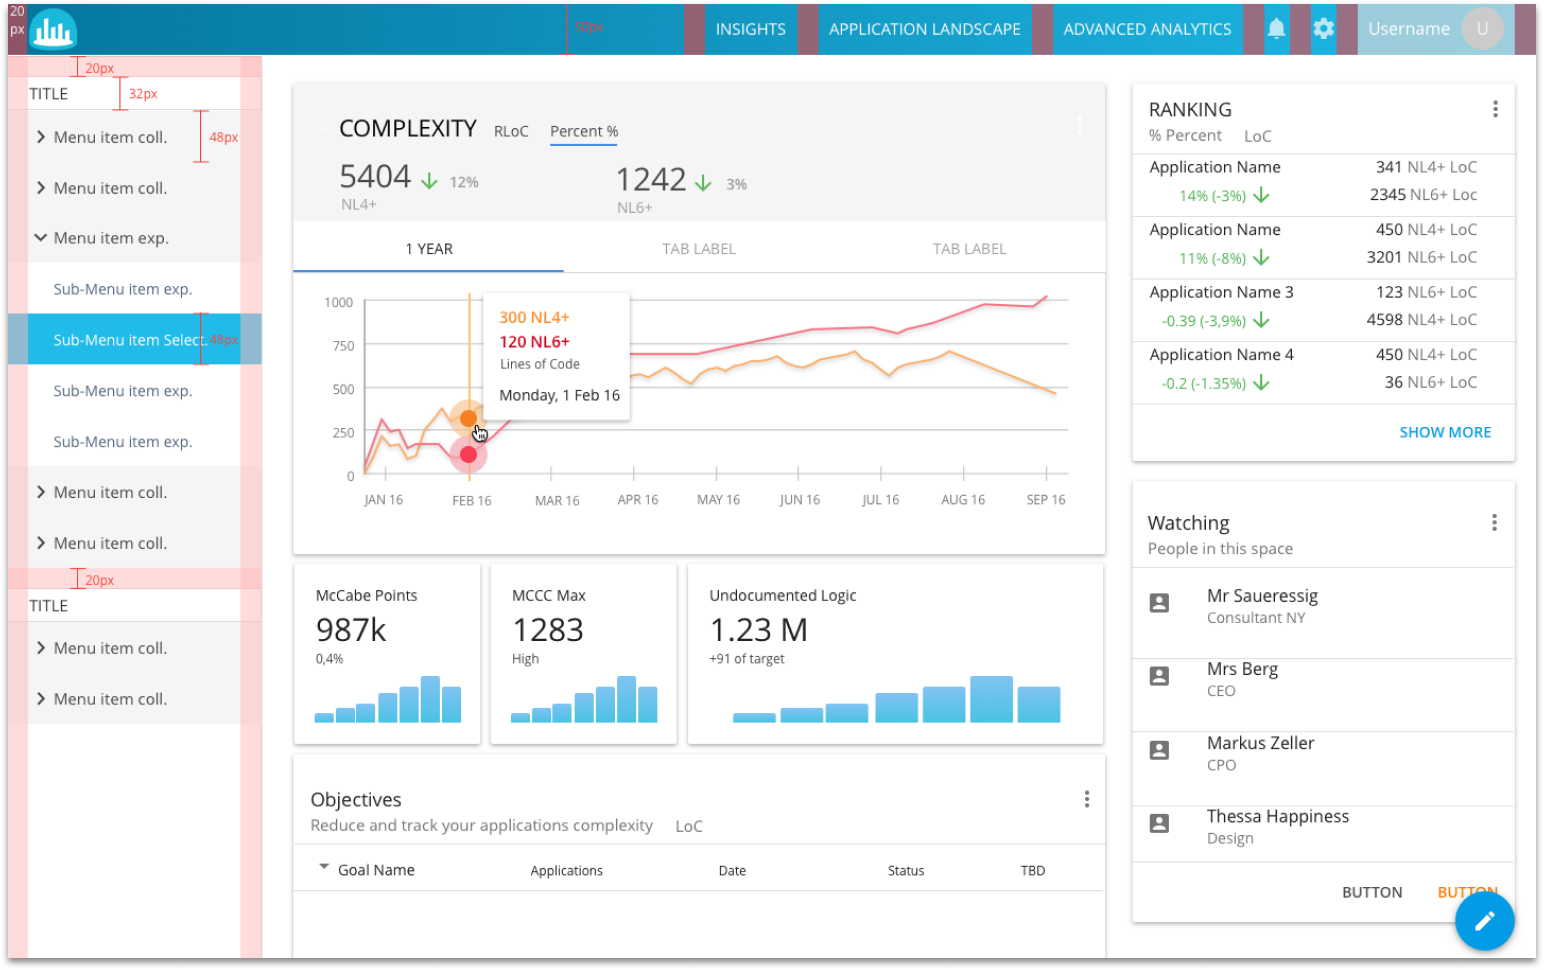
Dual-Track Implementation: Quick Wins and Strategic Planning
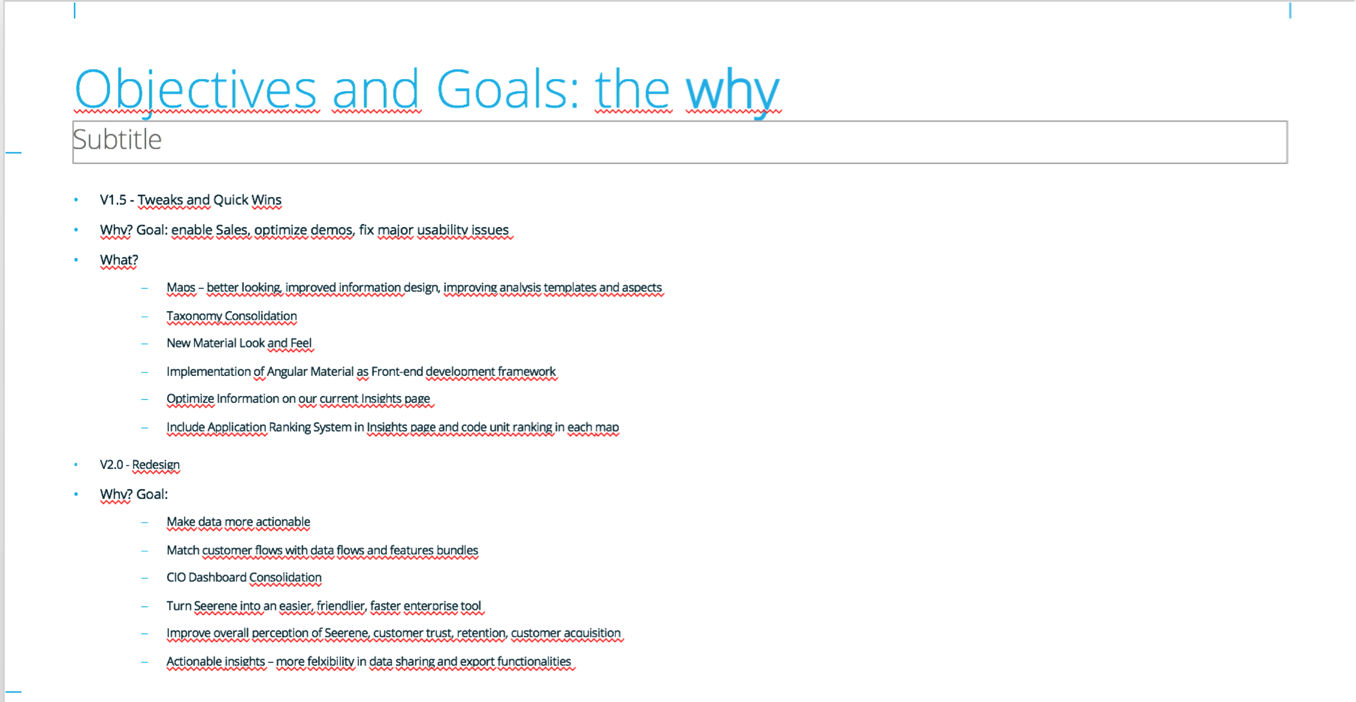
We agreed to work on two parallel tracks. After conducting a comprehensive usability review, we launched bi-weekly incremental improvements targeting immediate pain points: data visualization clarity, naming conventions, filtering mechanisms, and core user interactions.
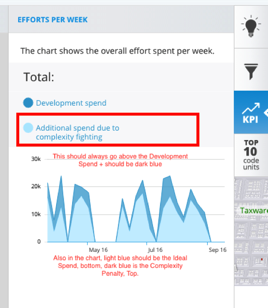
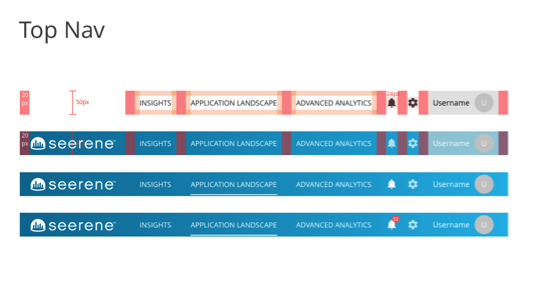
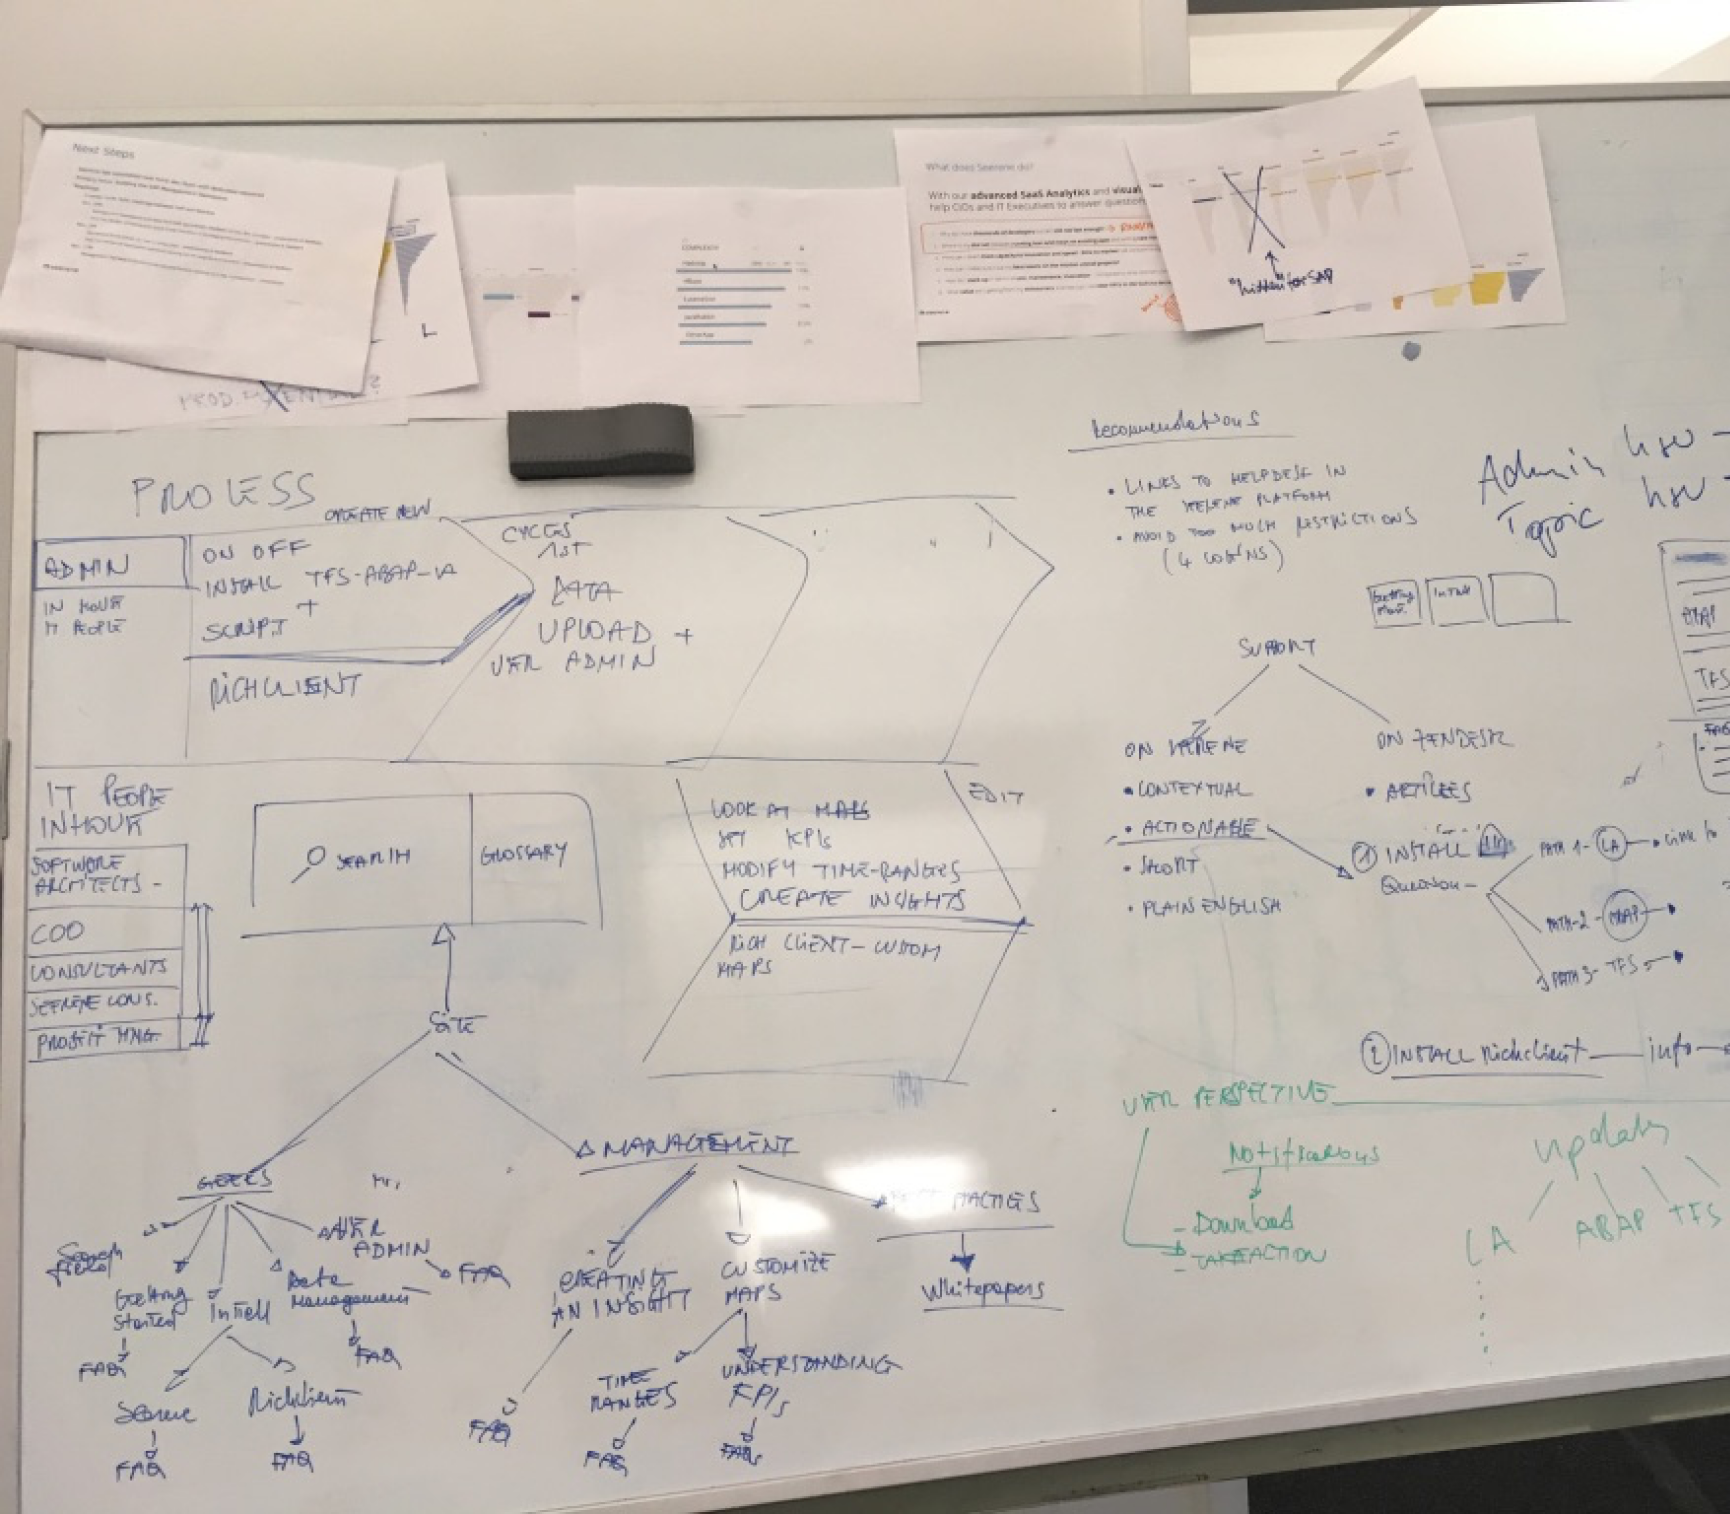
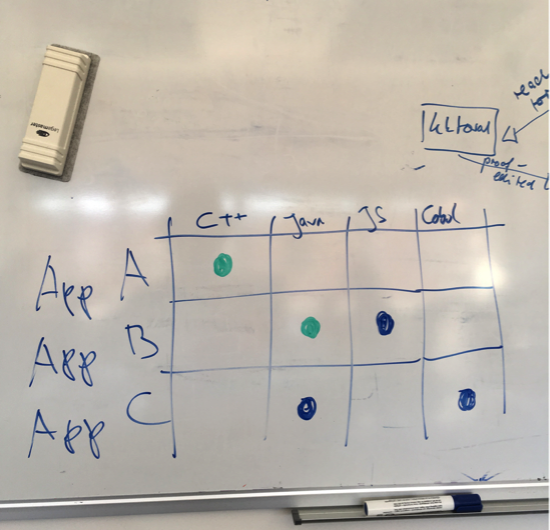
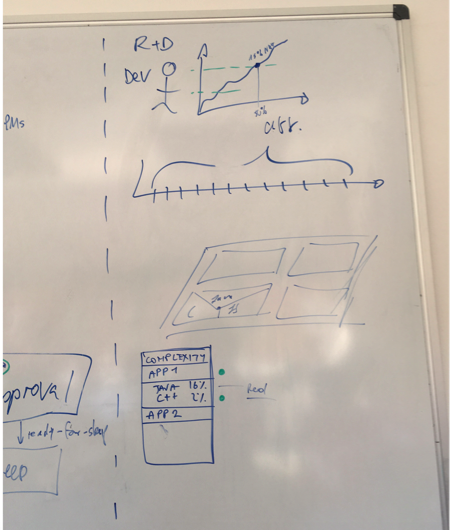
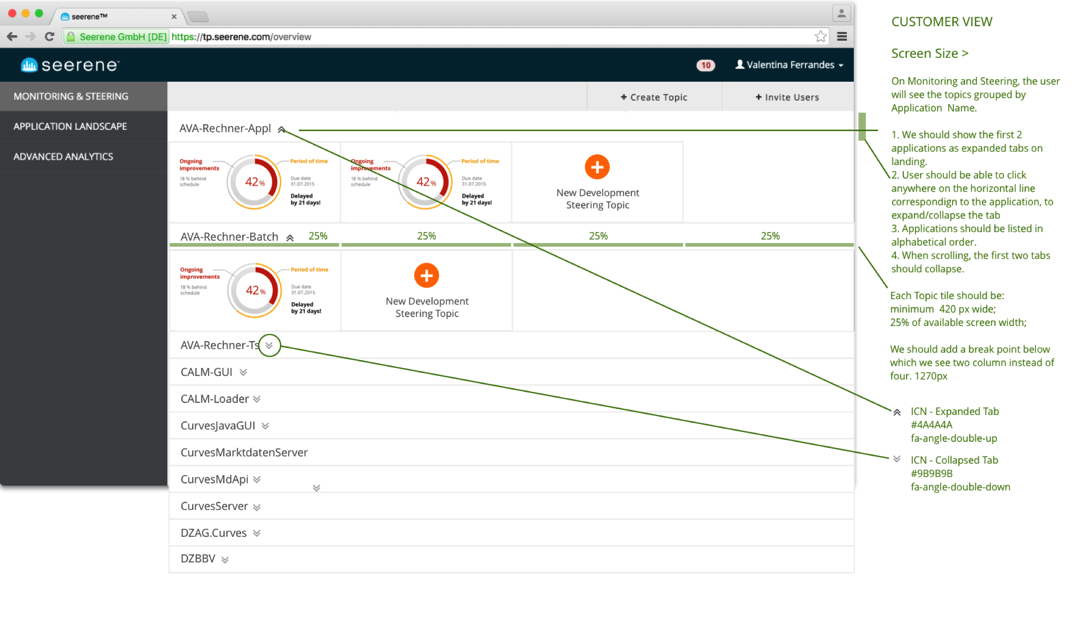
I run weekly whiteboard sessions with engineering and sales teams to accelerate deployment and gather rapid client feedback on each iteration. Here are some of the design assets I attached to Jira tickets for our remote development team at STX in Poland.
The deployment of these quick wins was extremely well received by clients, who began providing regular, detailed feedback that informed our broader redesign strategy. This approach built momentum and user confidence while we developed the more comprehensive platform changes.
Data Visualisation: 3D Software Maps
A major breakthrough came with our updated, high-contrast color scheme for the 3D software maps. Delivered as part of a comprehensive UI style guide, this change instantly made the product more visually appealing while significantly improving data visualization clarity for clients.
The new color system didn't just enhance aesthetics, it made complex code quality patterns immediately more readable, allowing users to identify critical areas and optimization opportunities at a glance.
Making the complex, simple
We wanted to move toward simplicity and ease of use—no small feat for a product built on sophisticated machine learning algorithms. With complex enterprise tools, there's rarely a quick fix for usability challenges.
We worked collaboratively across teams to define what kind of product Seerene needed to become to succeed in the competitive SaaS landscape. This strategic alignment process helped us identify which complexities were essential to preserve and which were simply artifacts of the platform's academic origins.
The goal was clear: maintain analytical depth while creating an experience that felt intuitive rather than intimidating.
Results: Turning Academic Research into User-Friendly Product
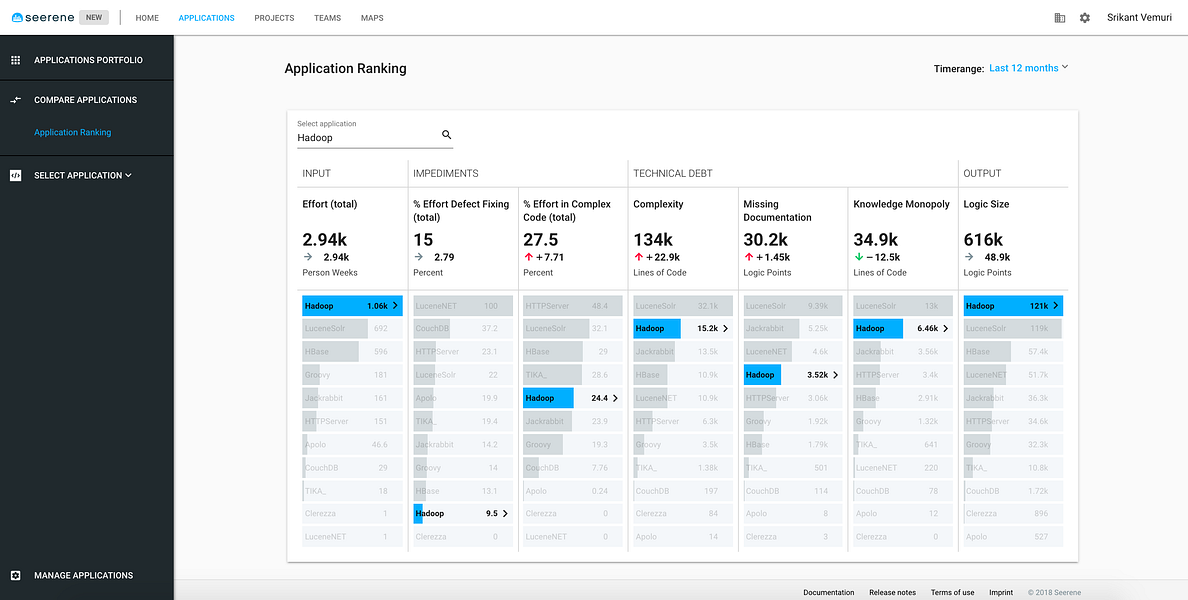
Our product updates hit the mark with both clients and investors. The platform became genuinely easier to navigate, and people finally understood what Seerene could do for enterprise development teams.
The redesigned interface meant engineering managers could actually find what they were looking for instead of getting lost in data complexity. Combined with major performance improvements, the platform transformed from feeling sluggish and intimidating to fast and intuitive.
What started as brilliant but buried academic research had become a tool that teams wanted to use daily, exactly the kind of transformation that gets both users and funders excited.